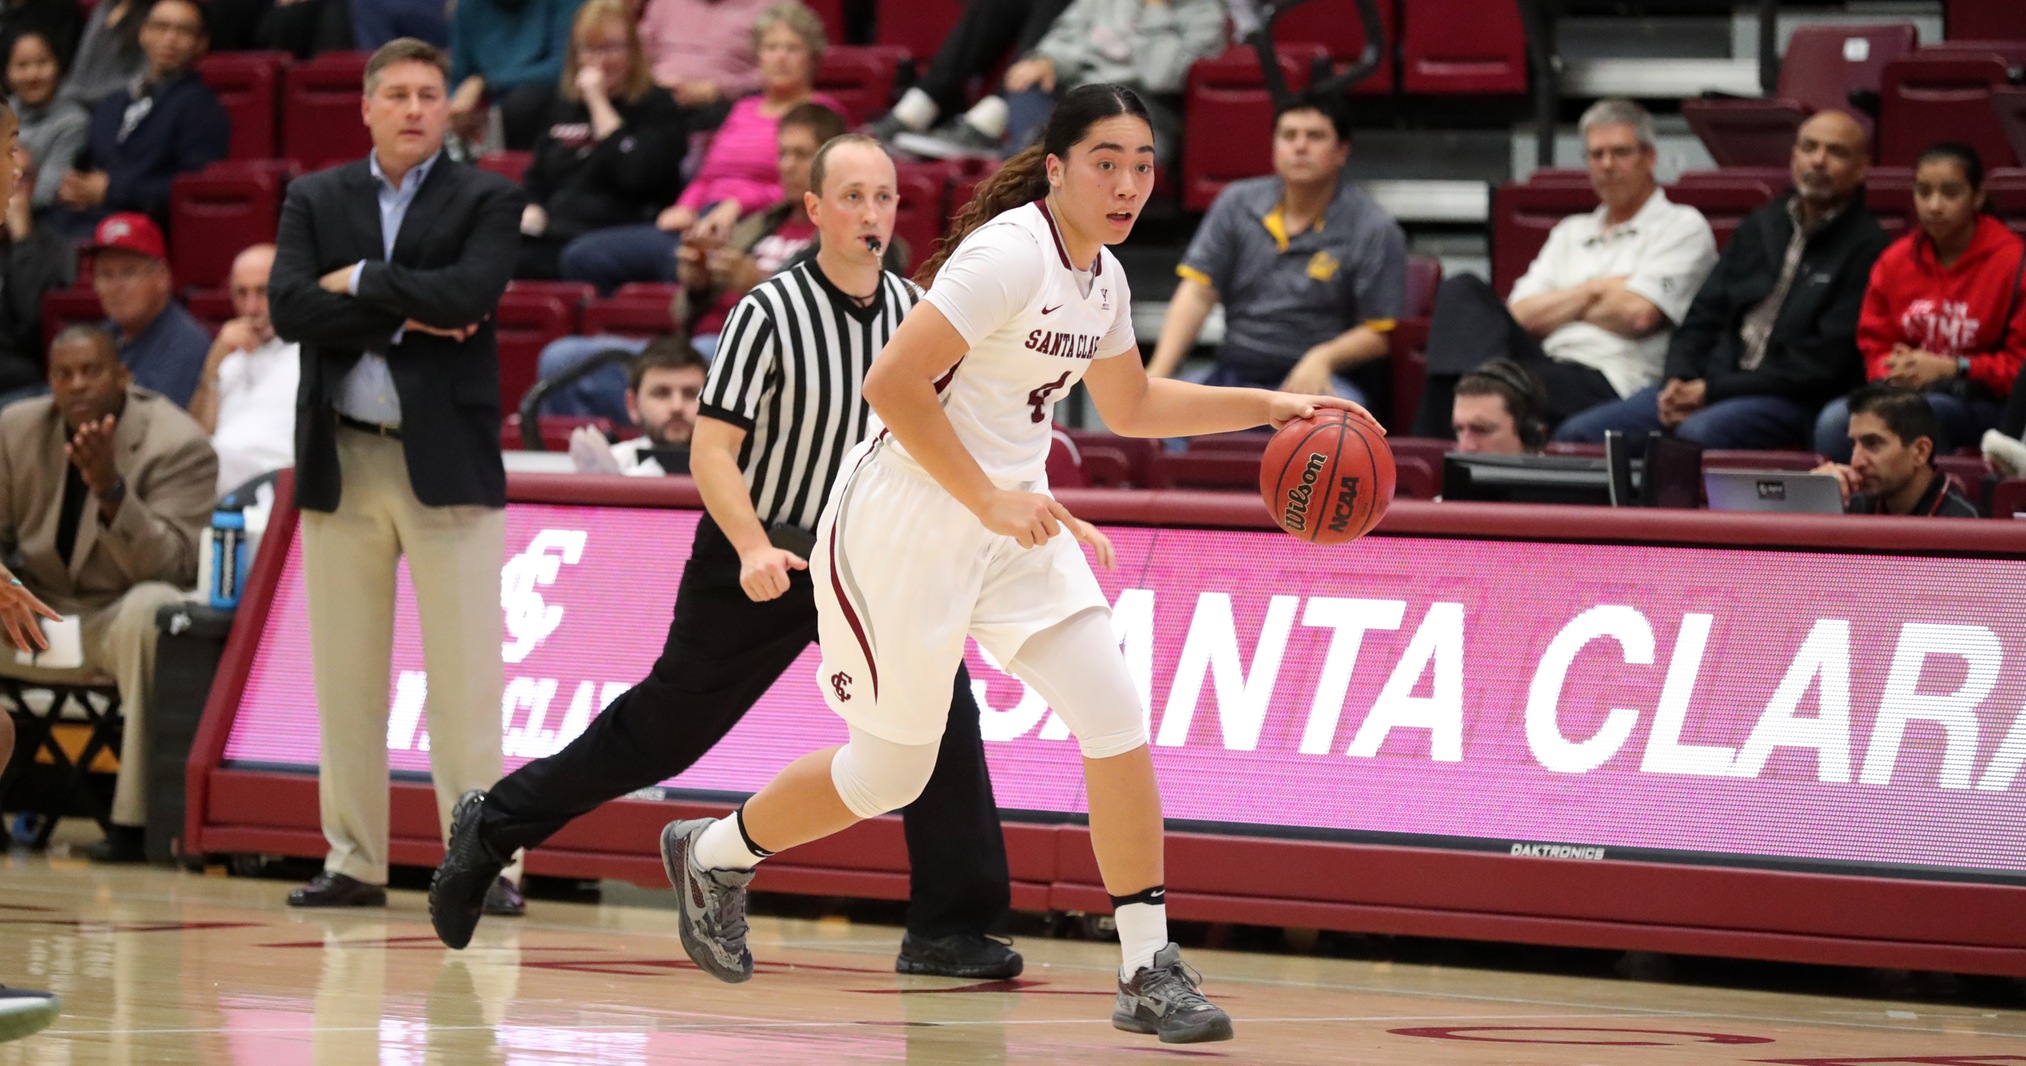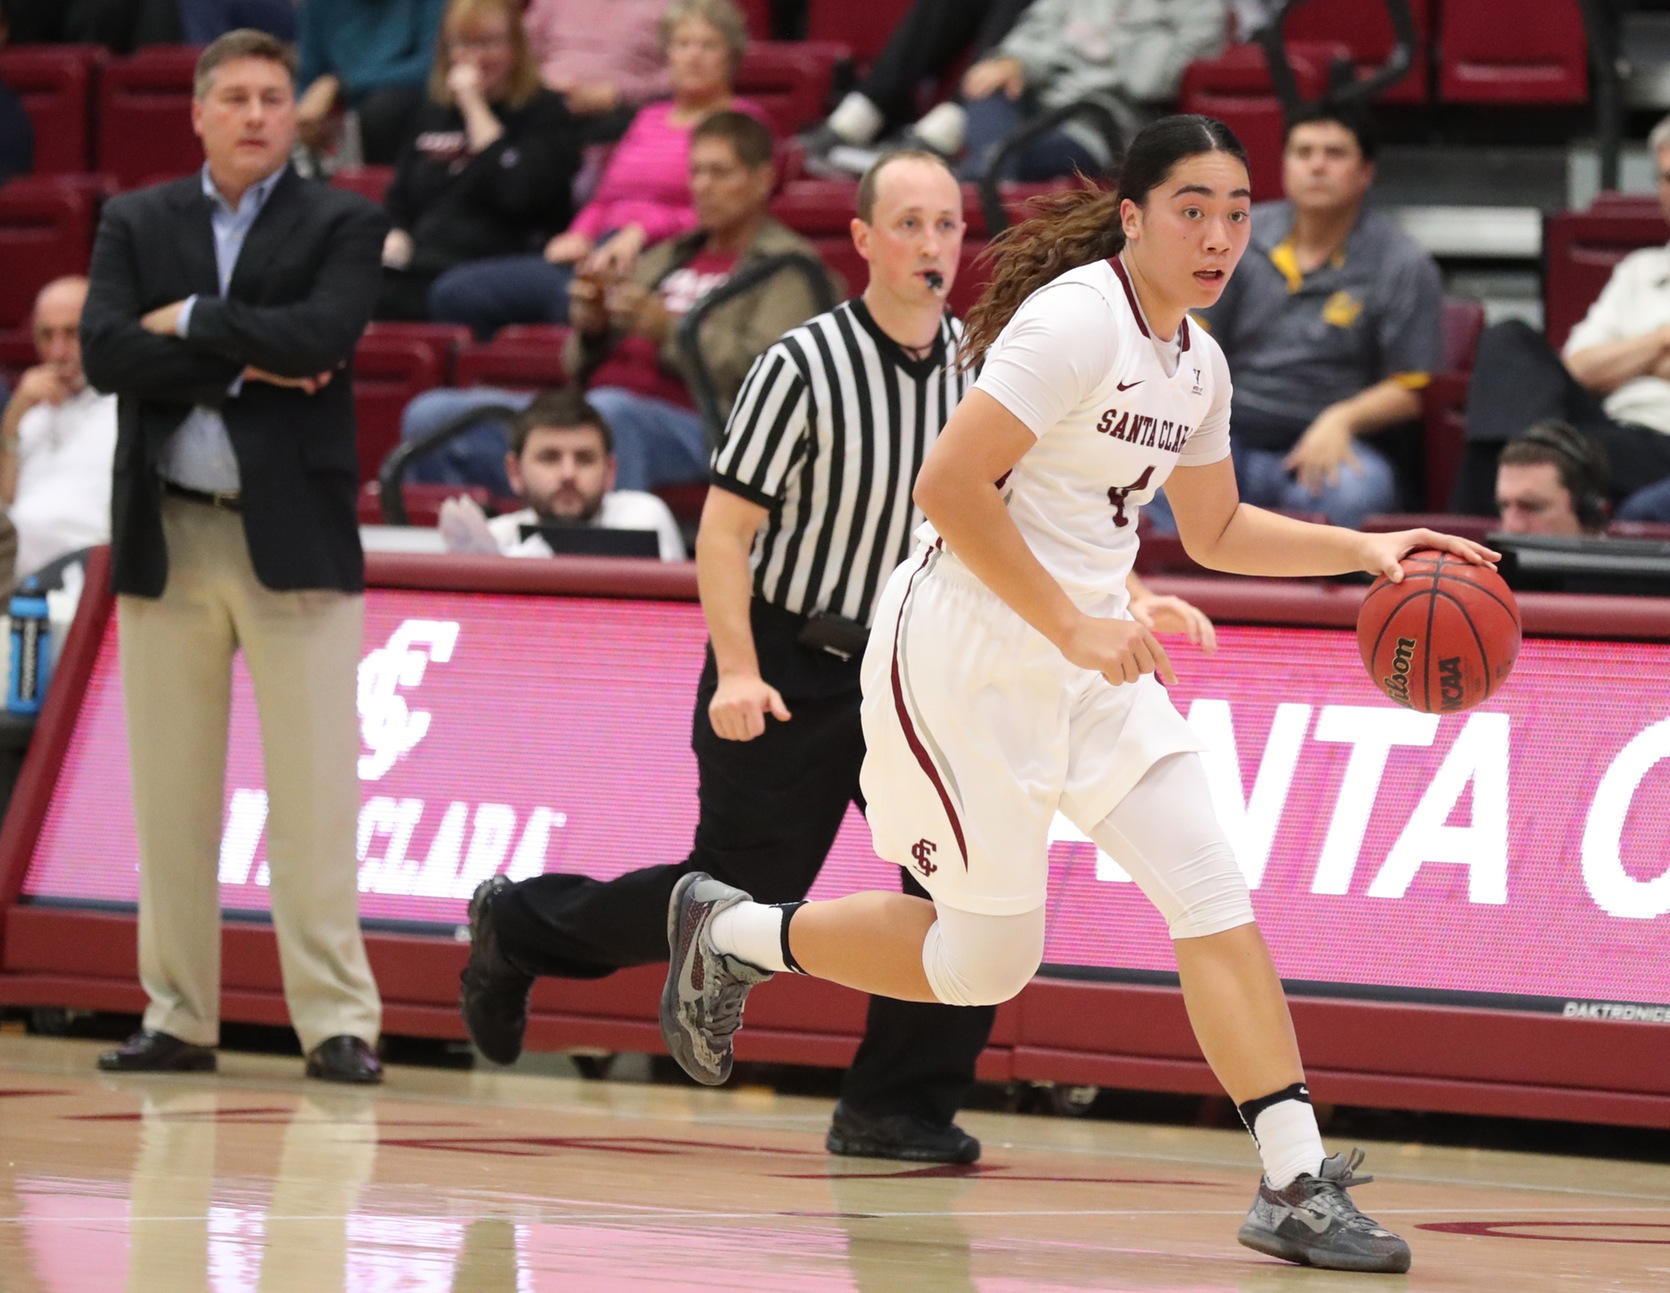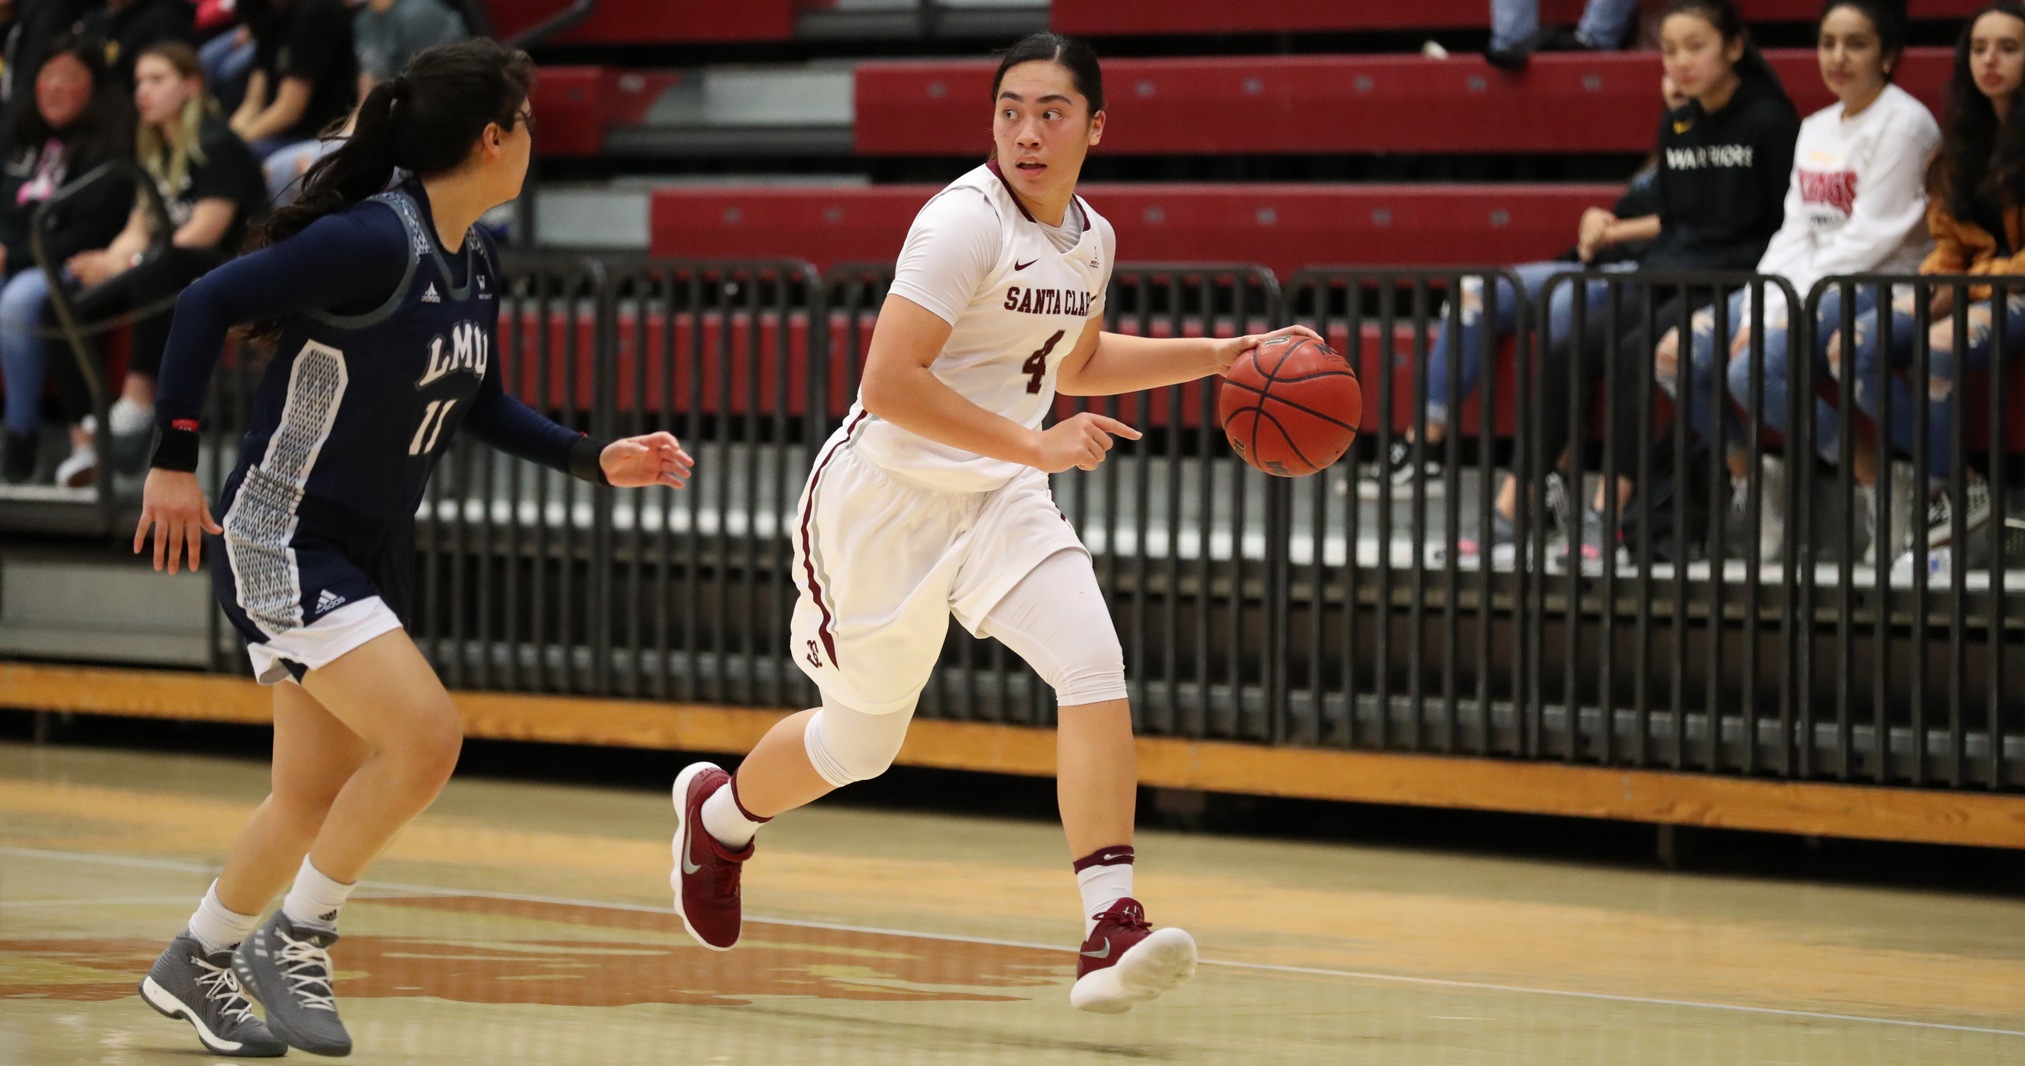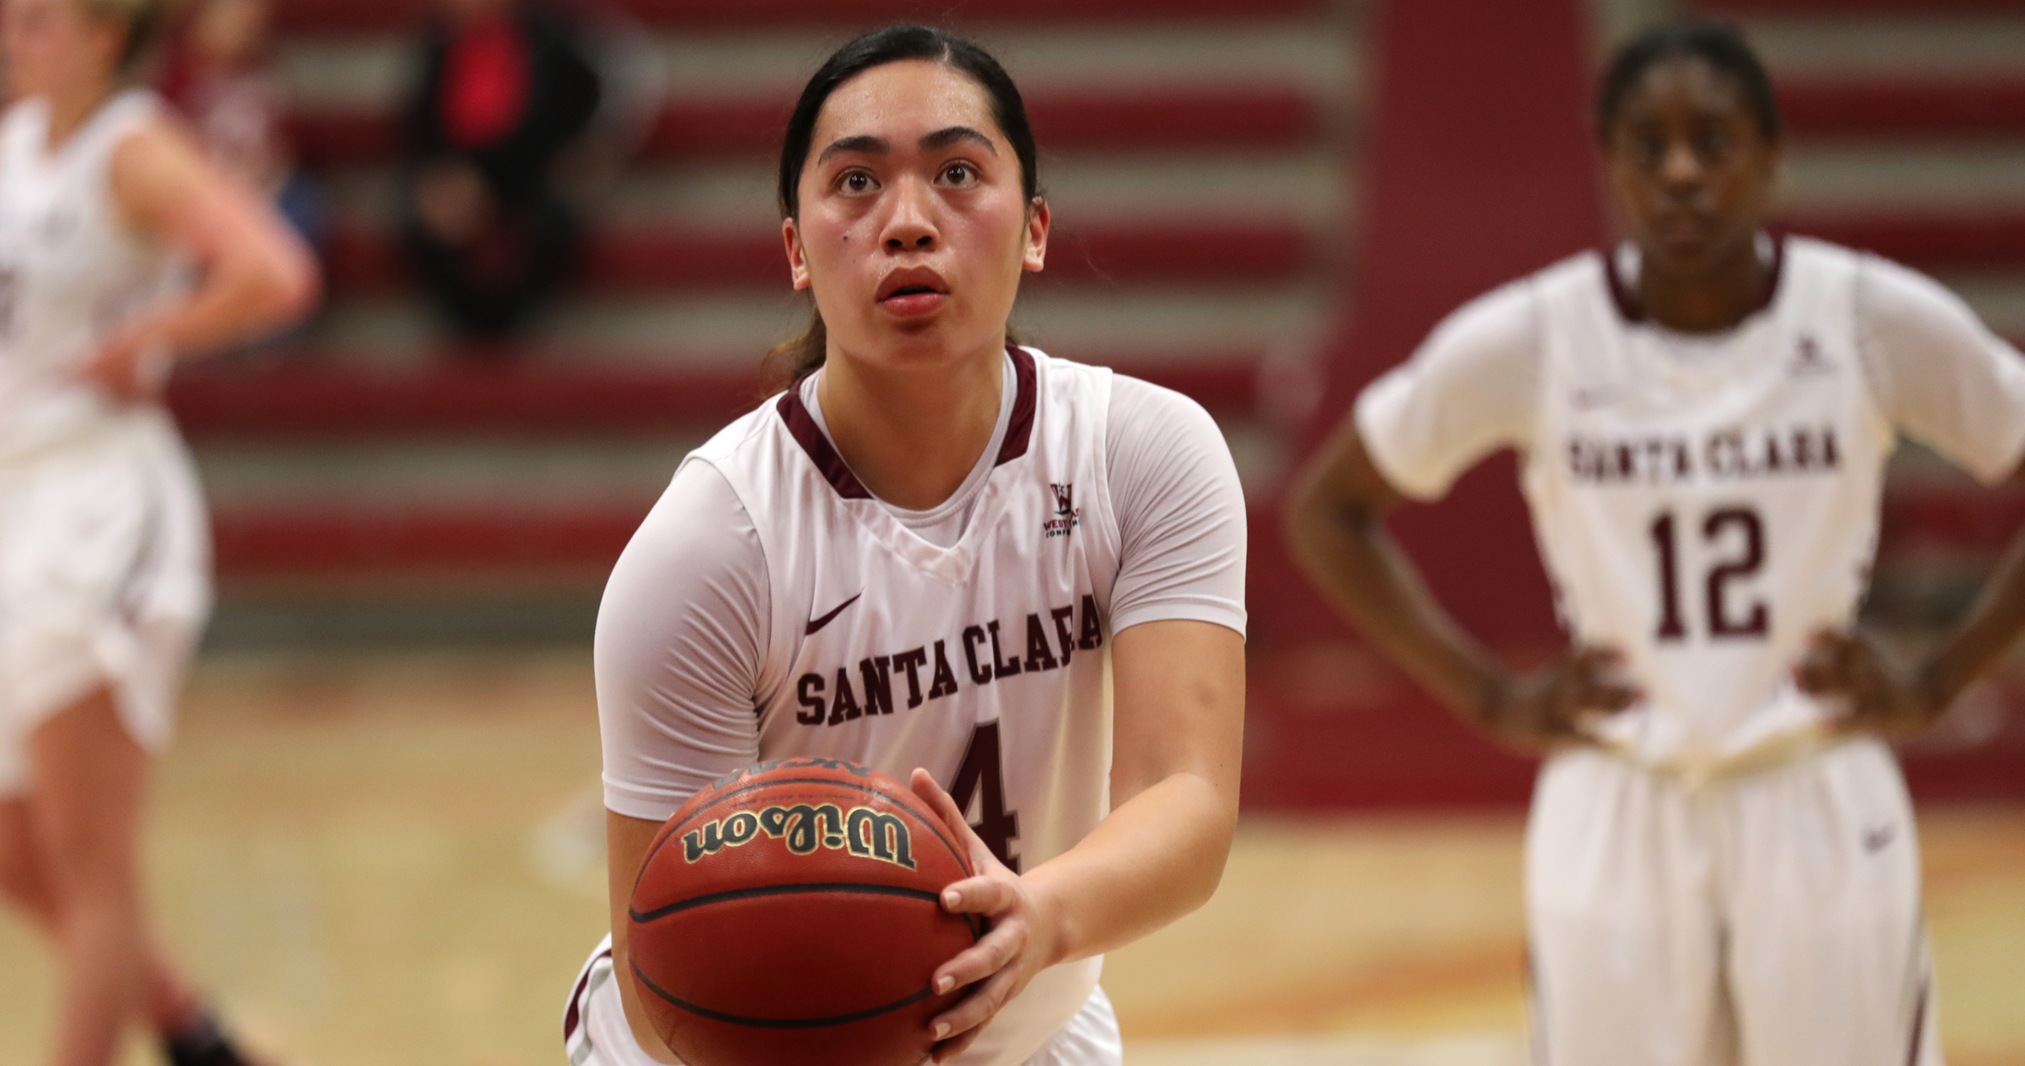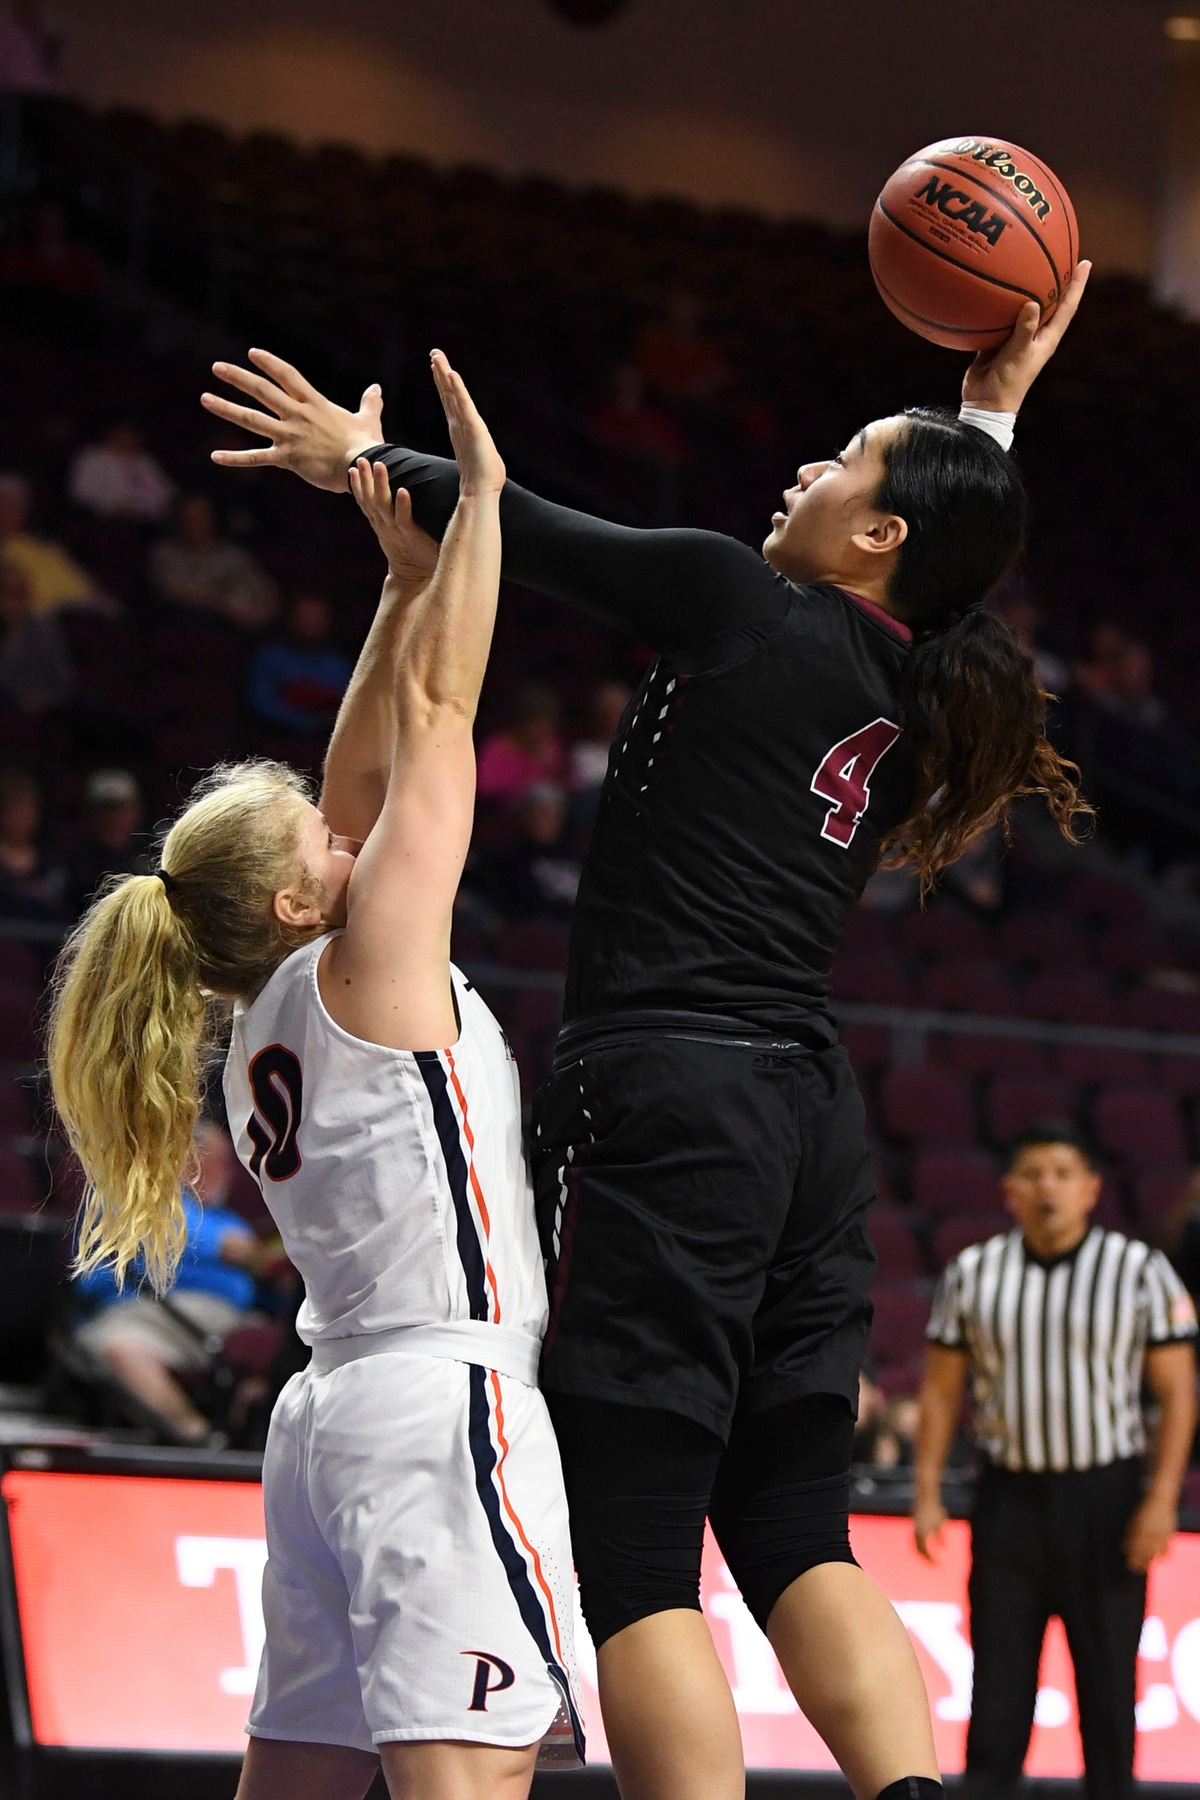
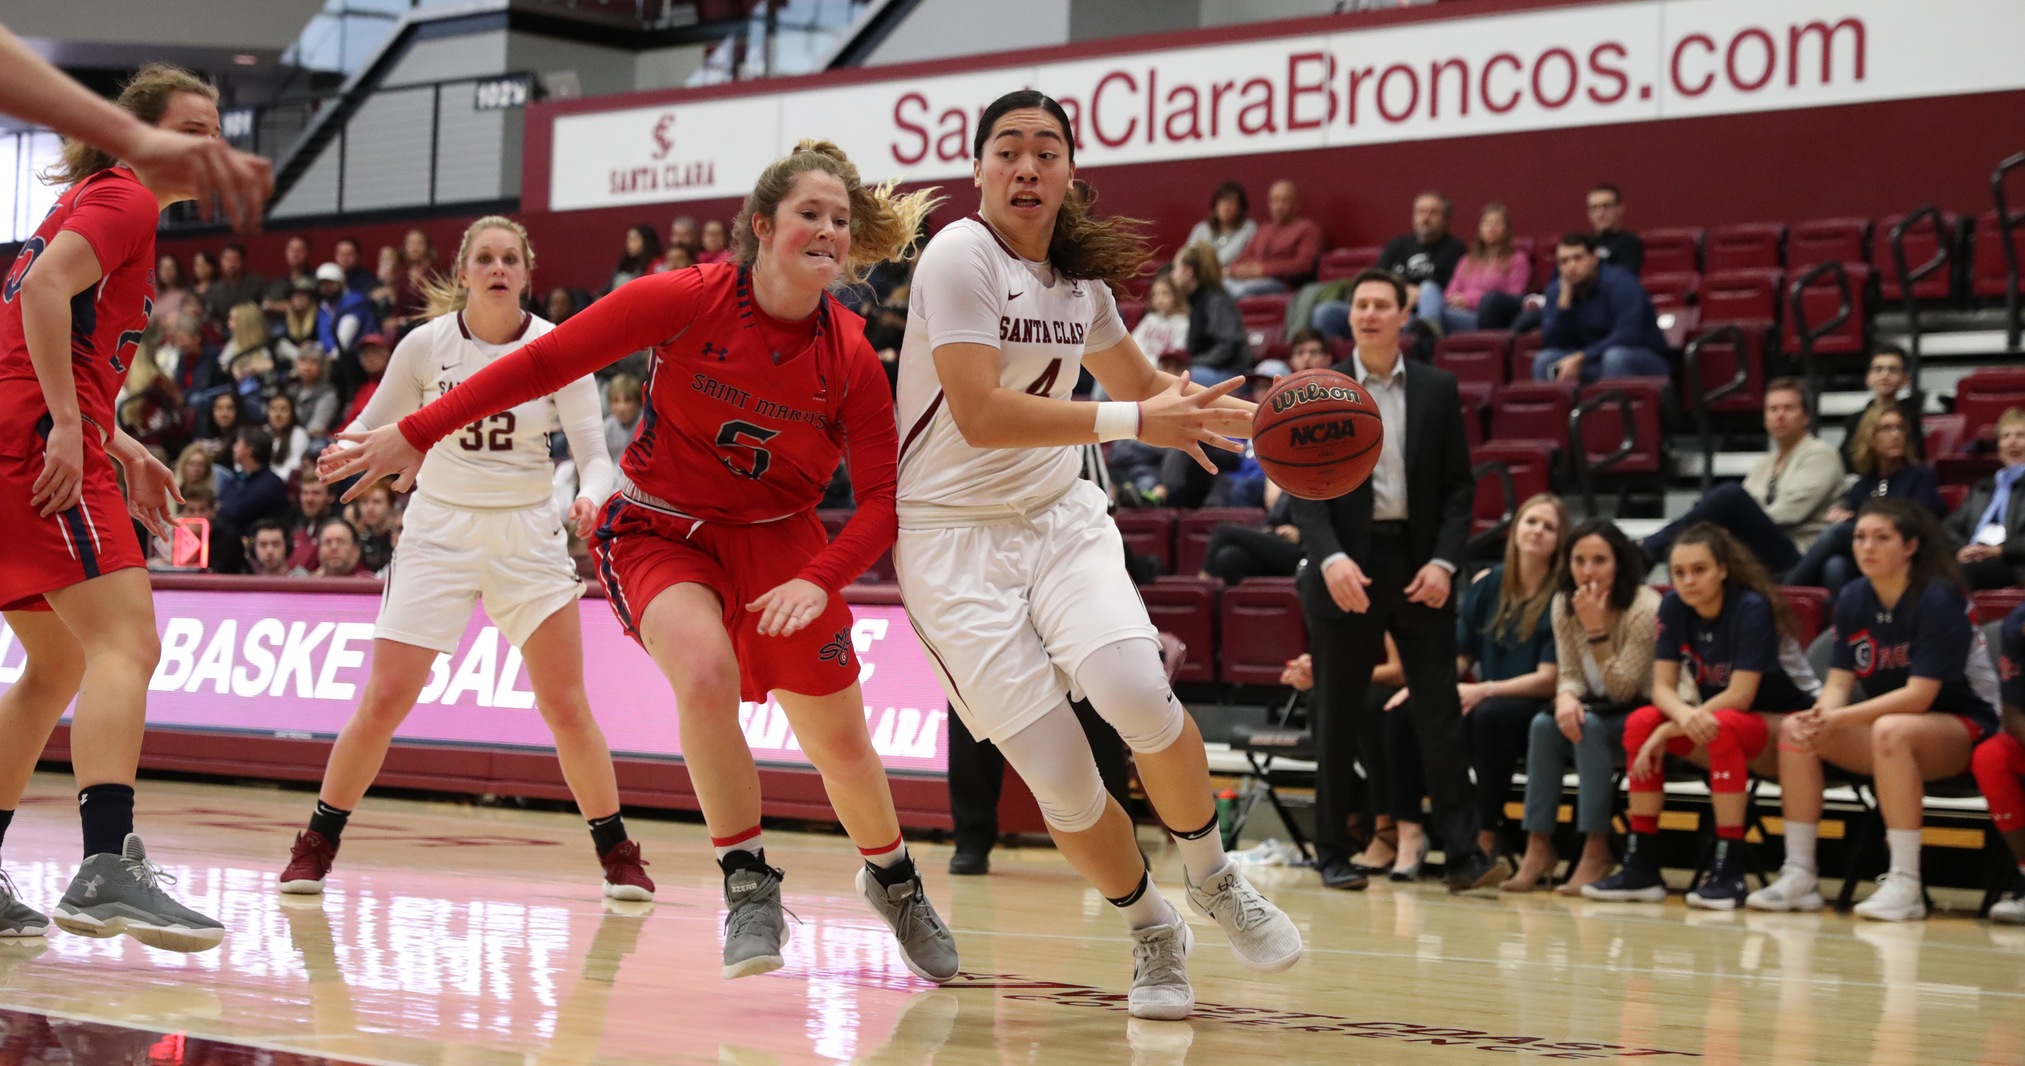
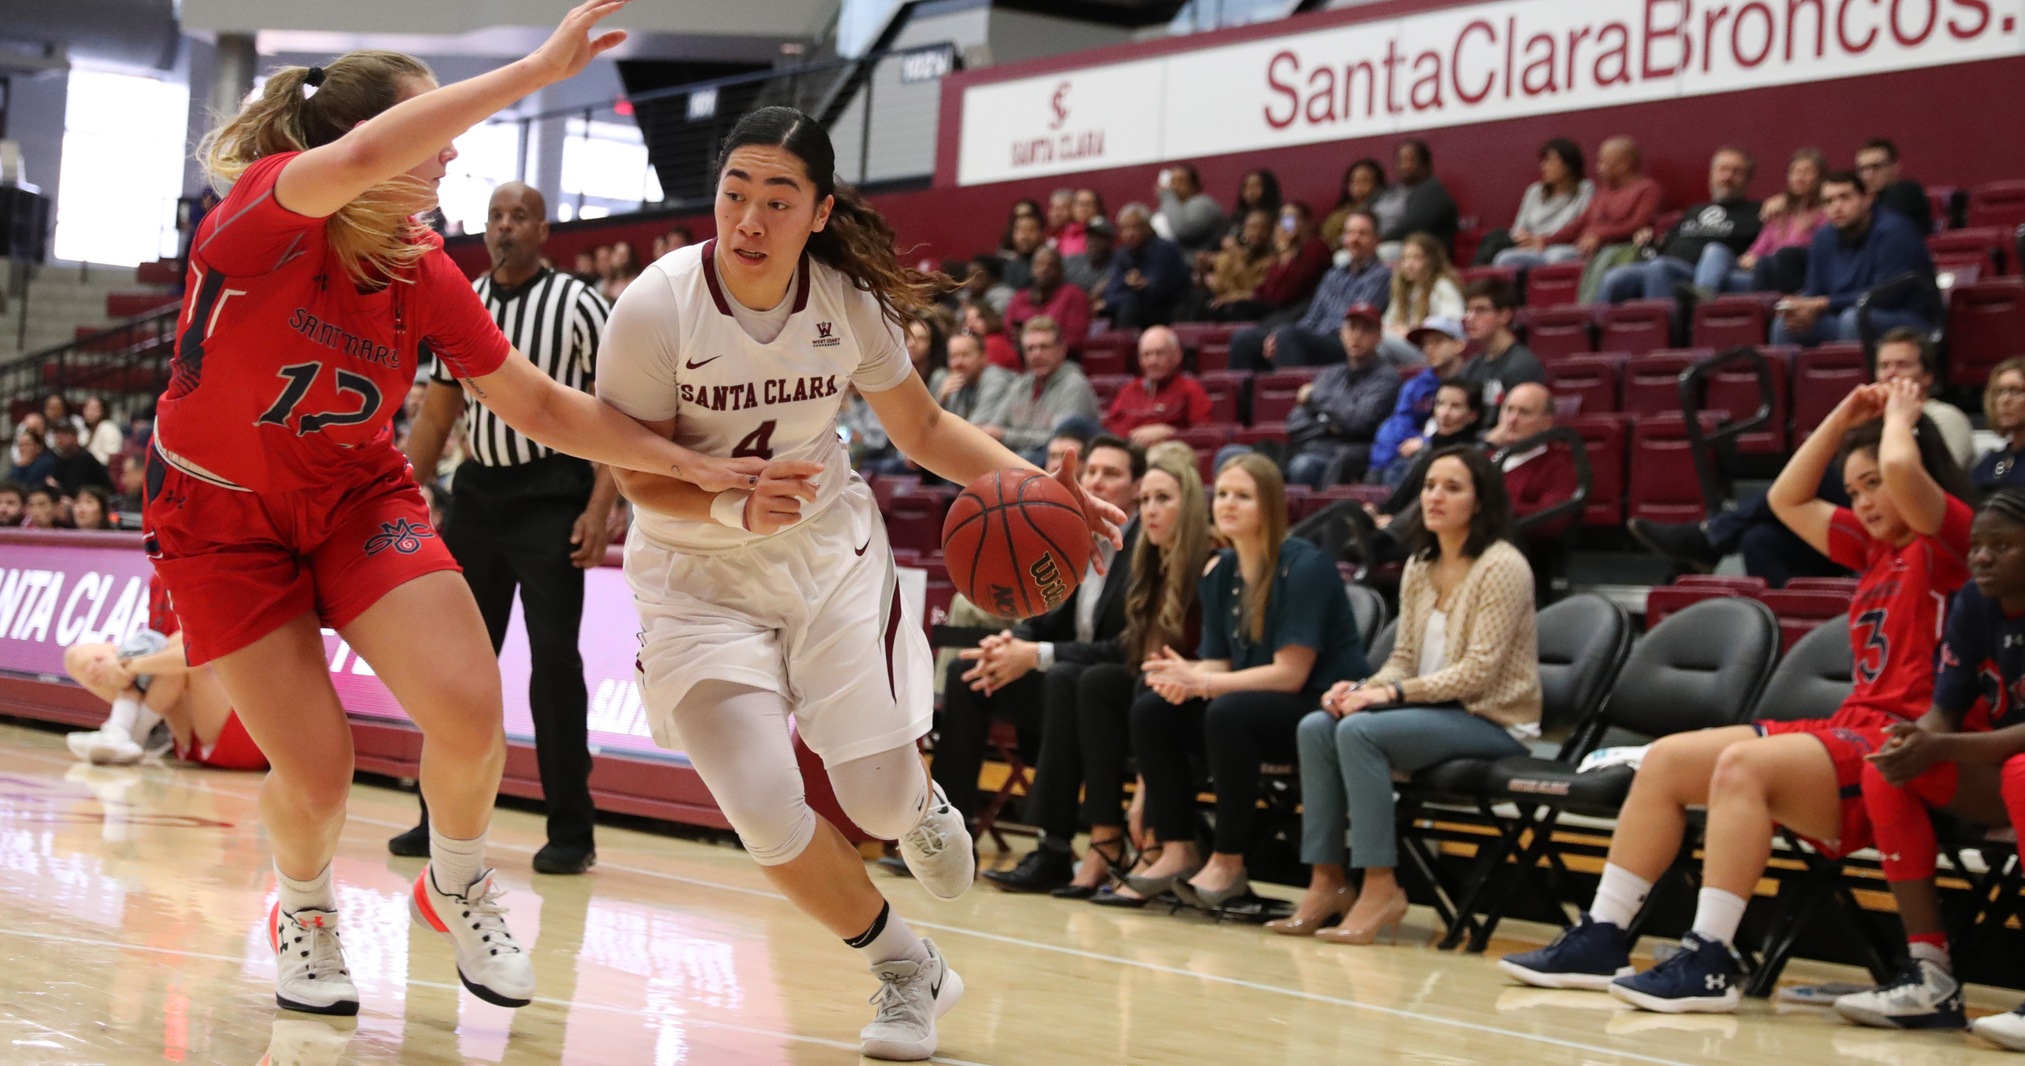
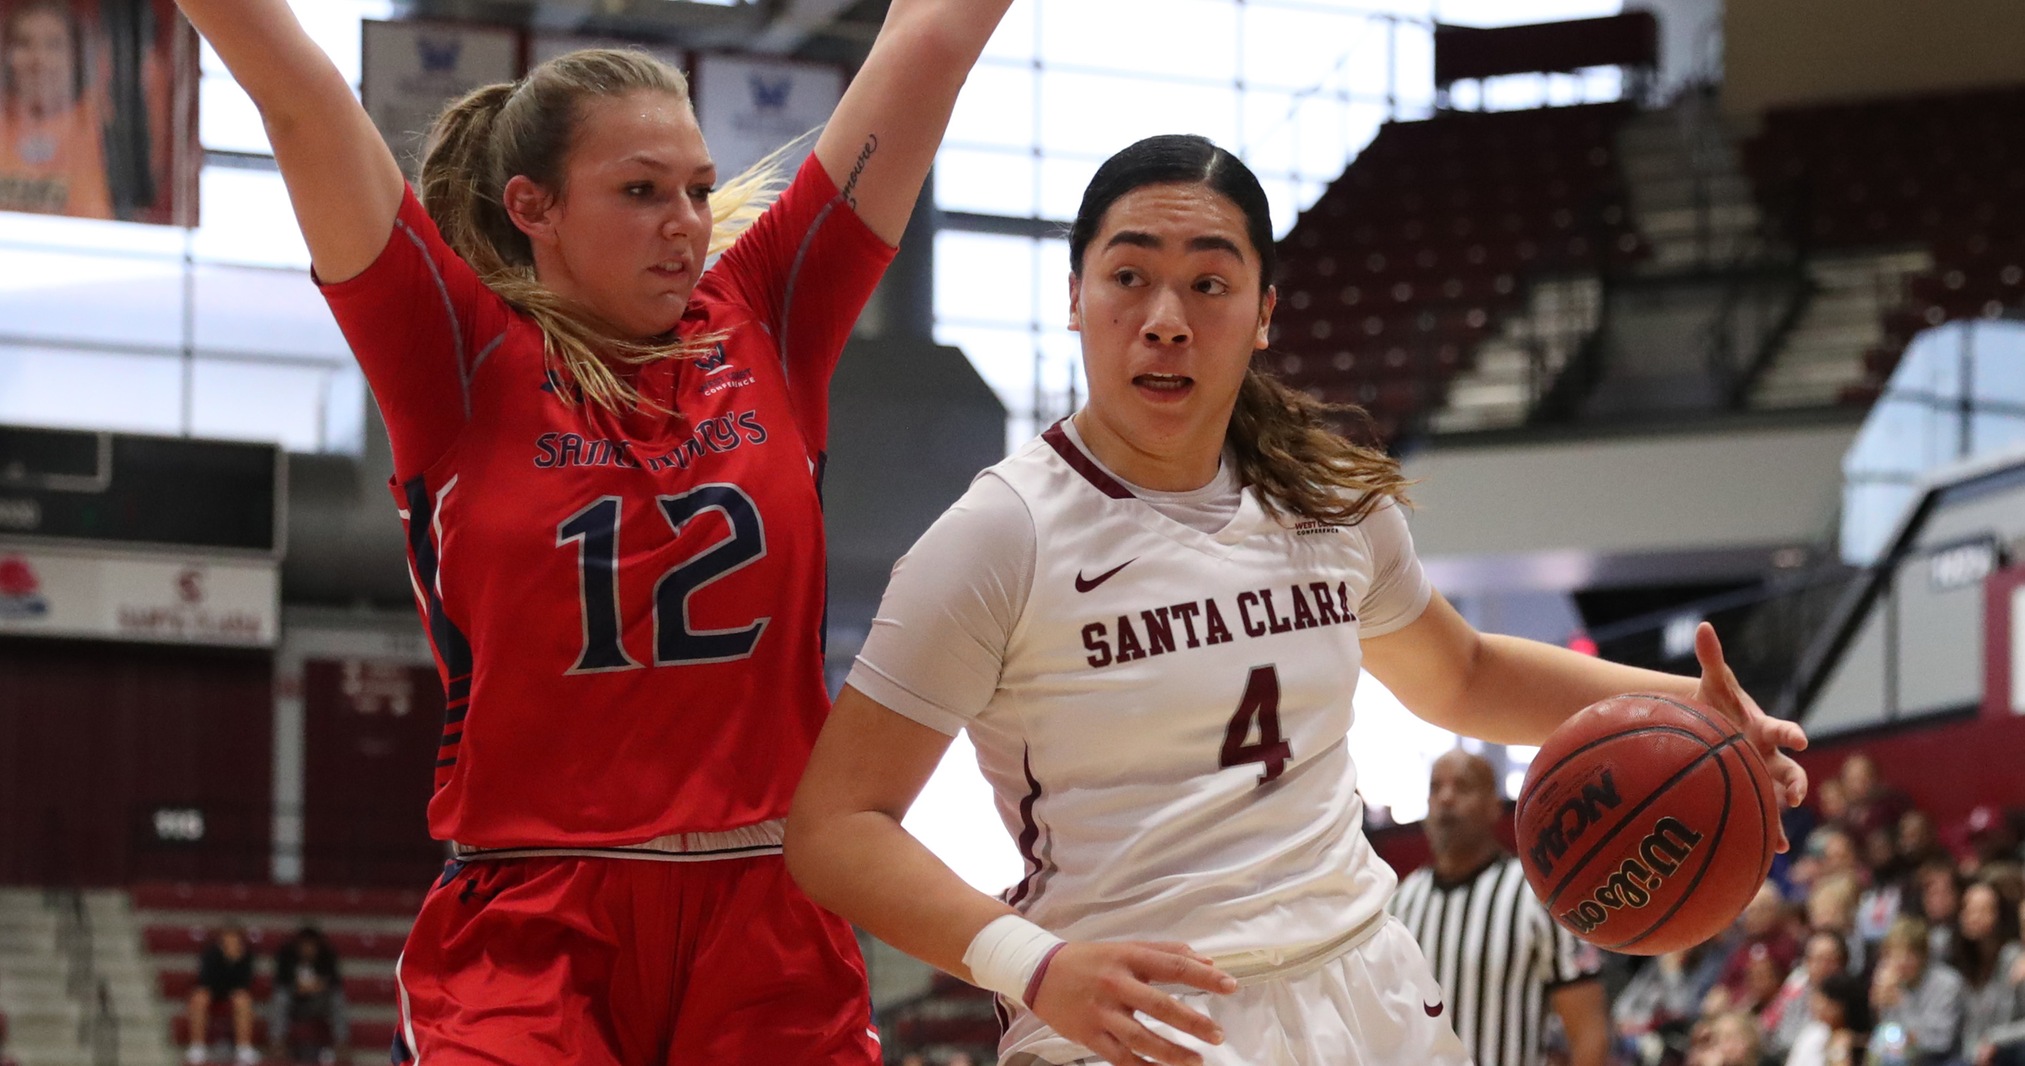
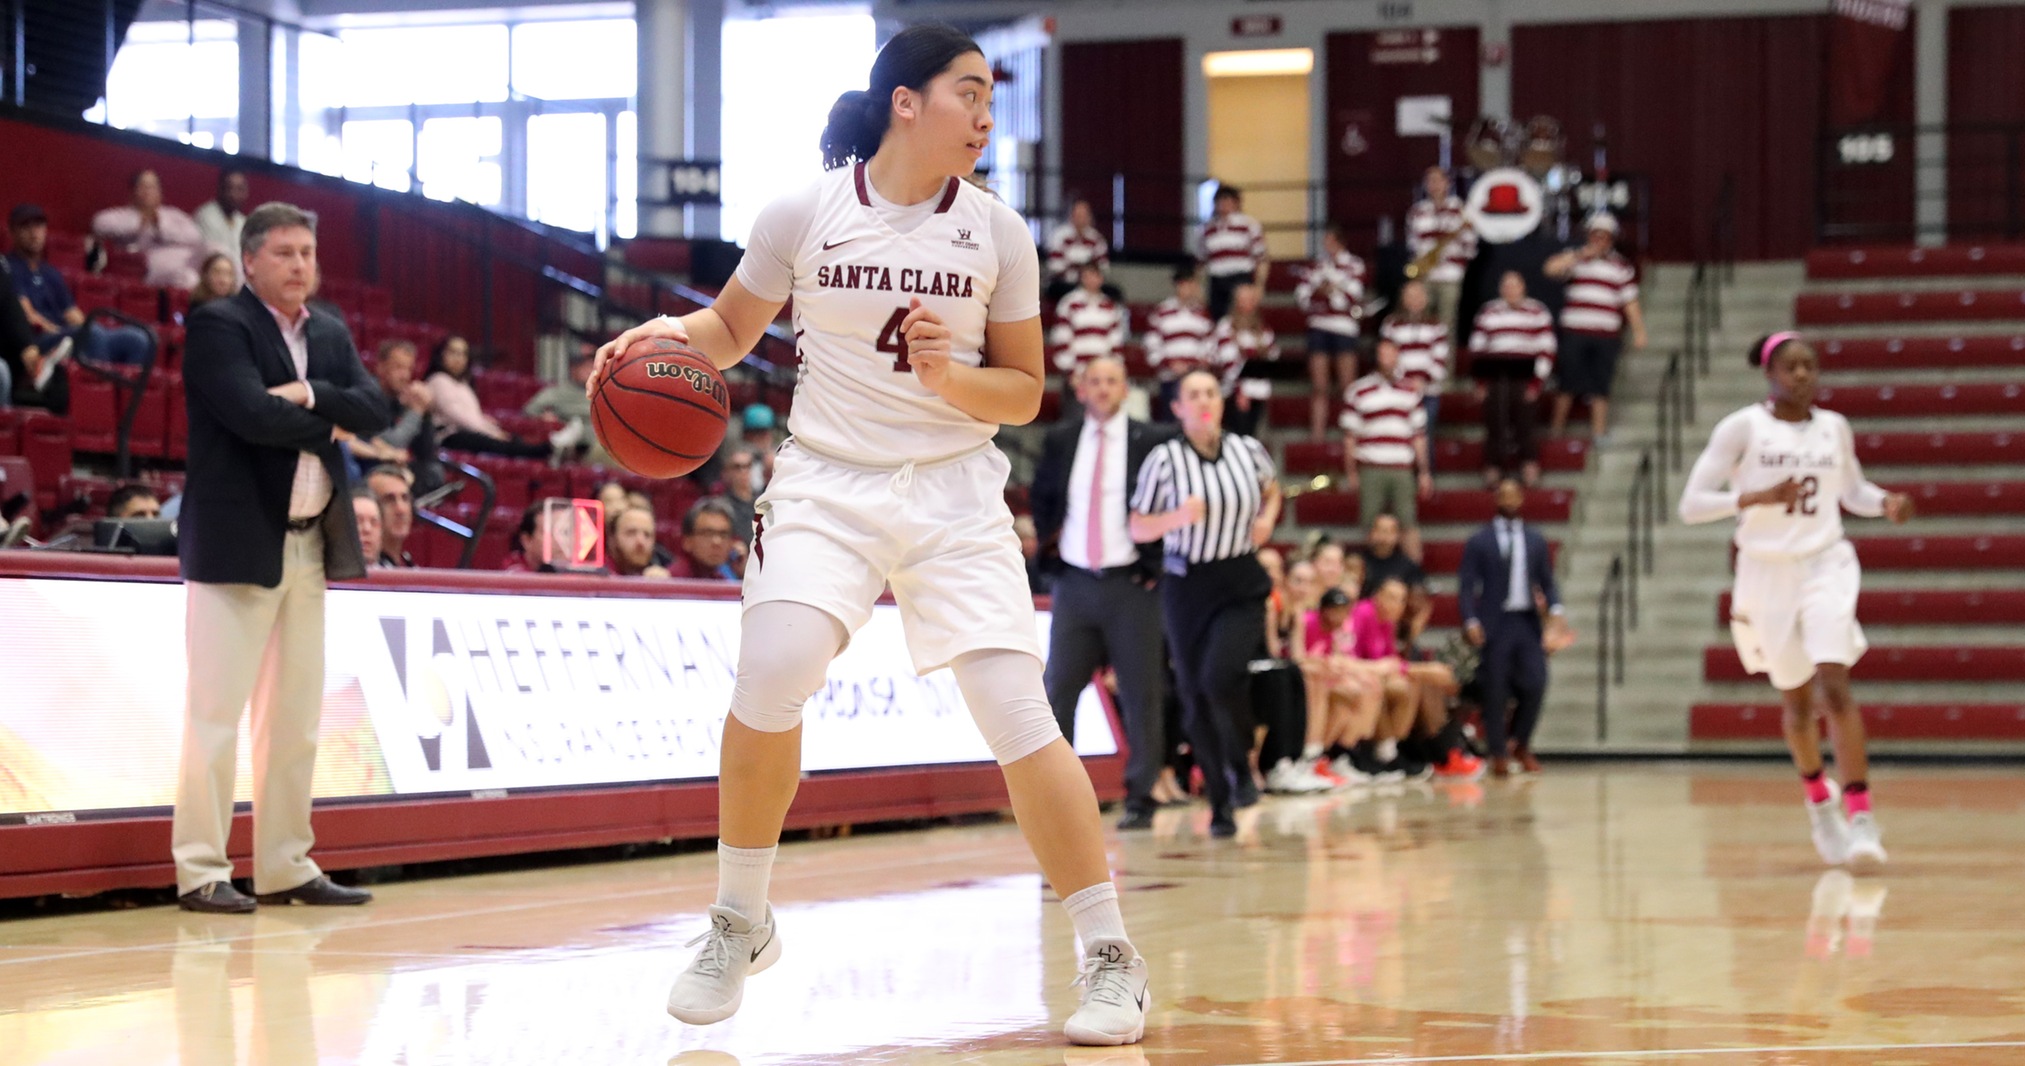

4 Dru Toleafoa
-
- Height:
- 6-0
-
- Year:
- Junior
-
- Hometown:
- Sydney, Australia
-
- High School:
- Brigidine College Randwick
-
- Position:
- Guard
-
- Major:
- Studying in the School of Engineering
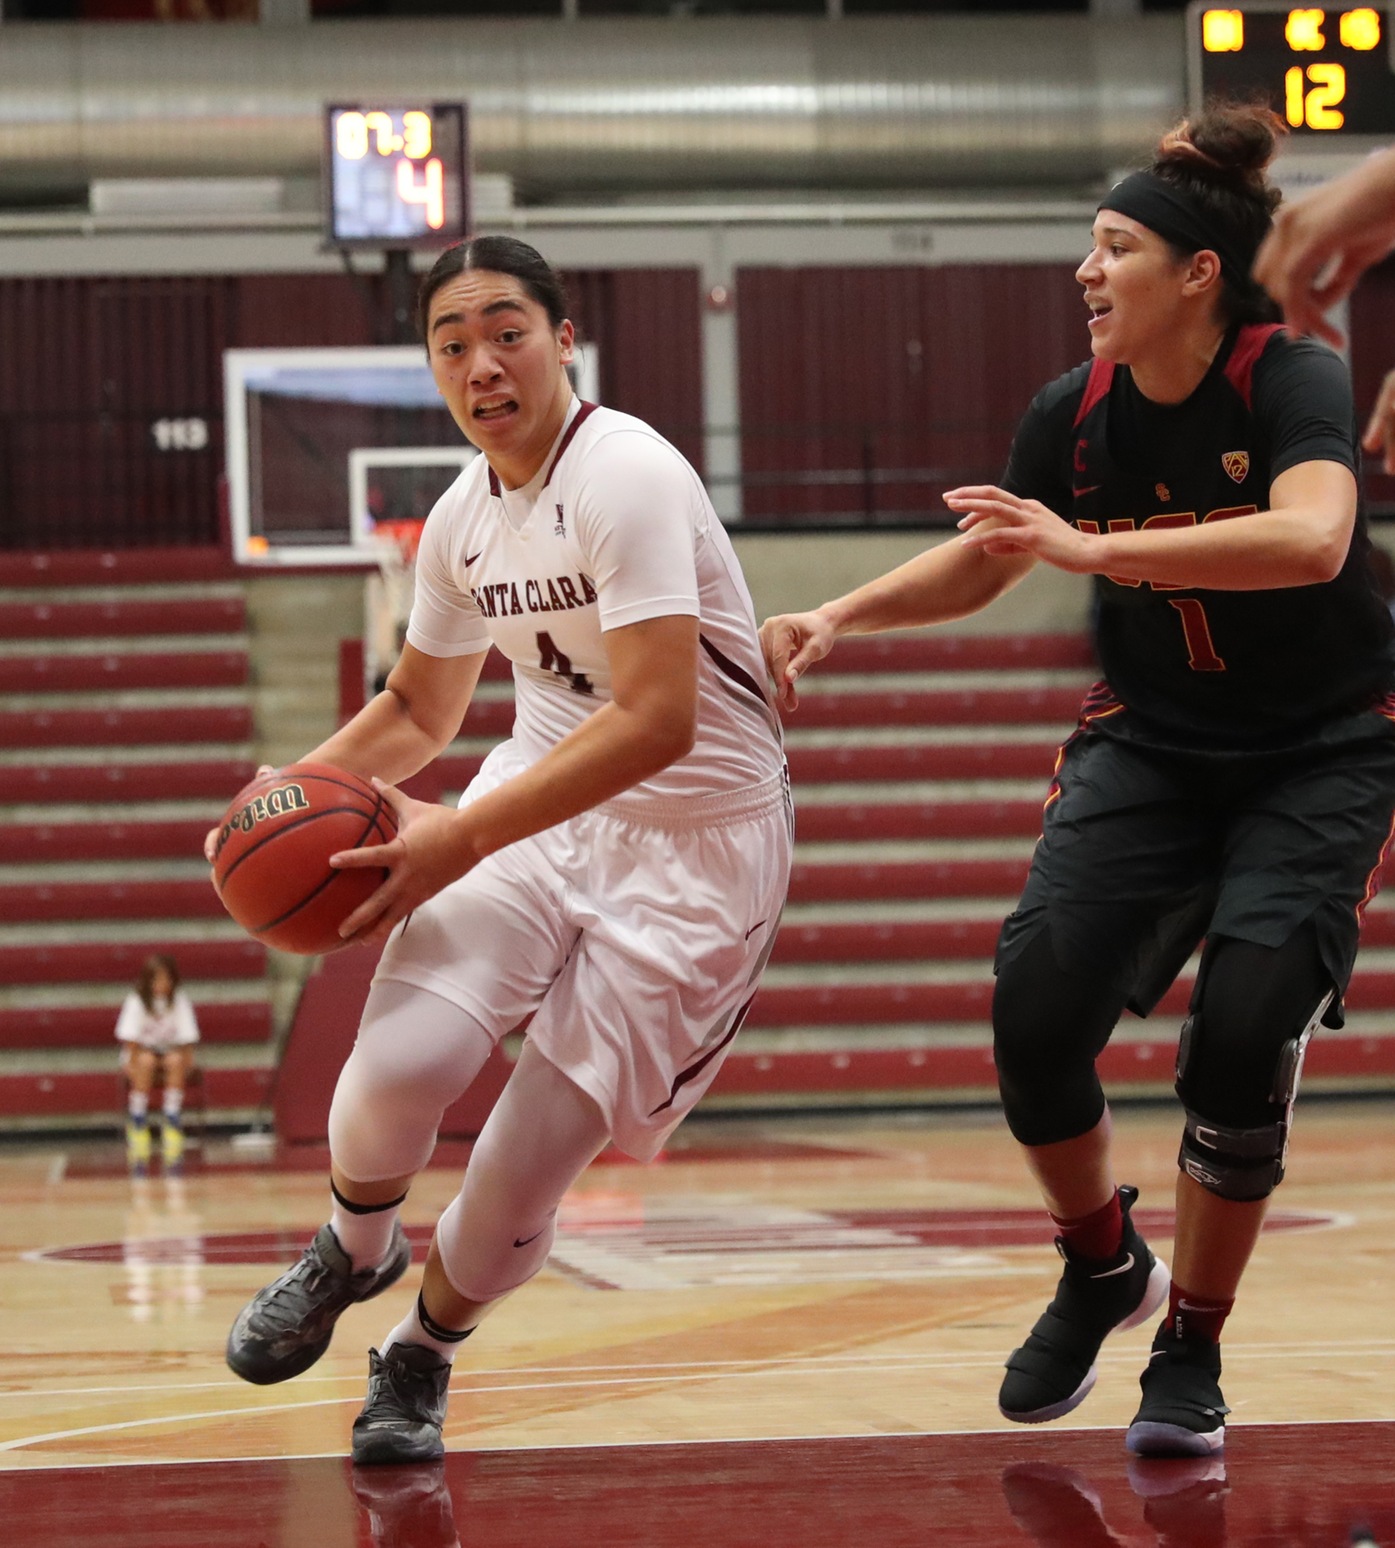
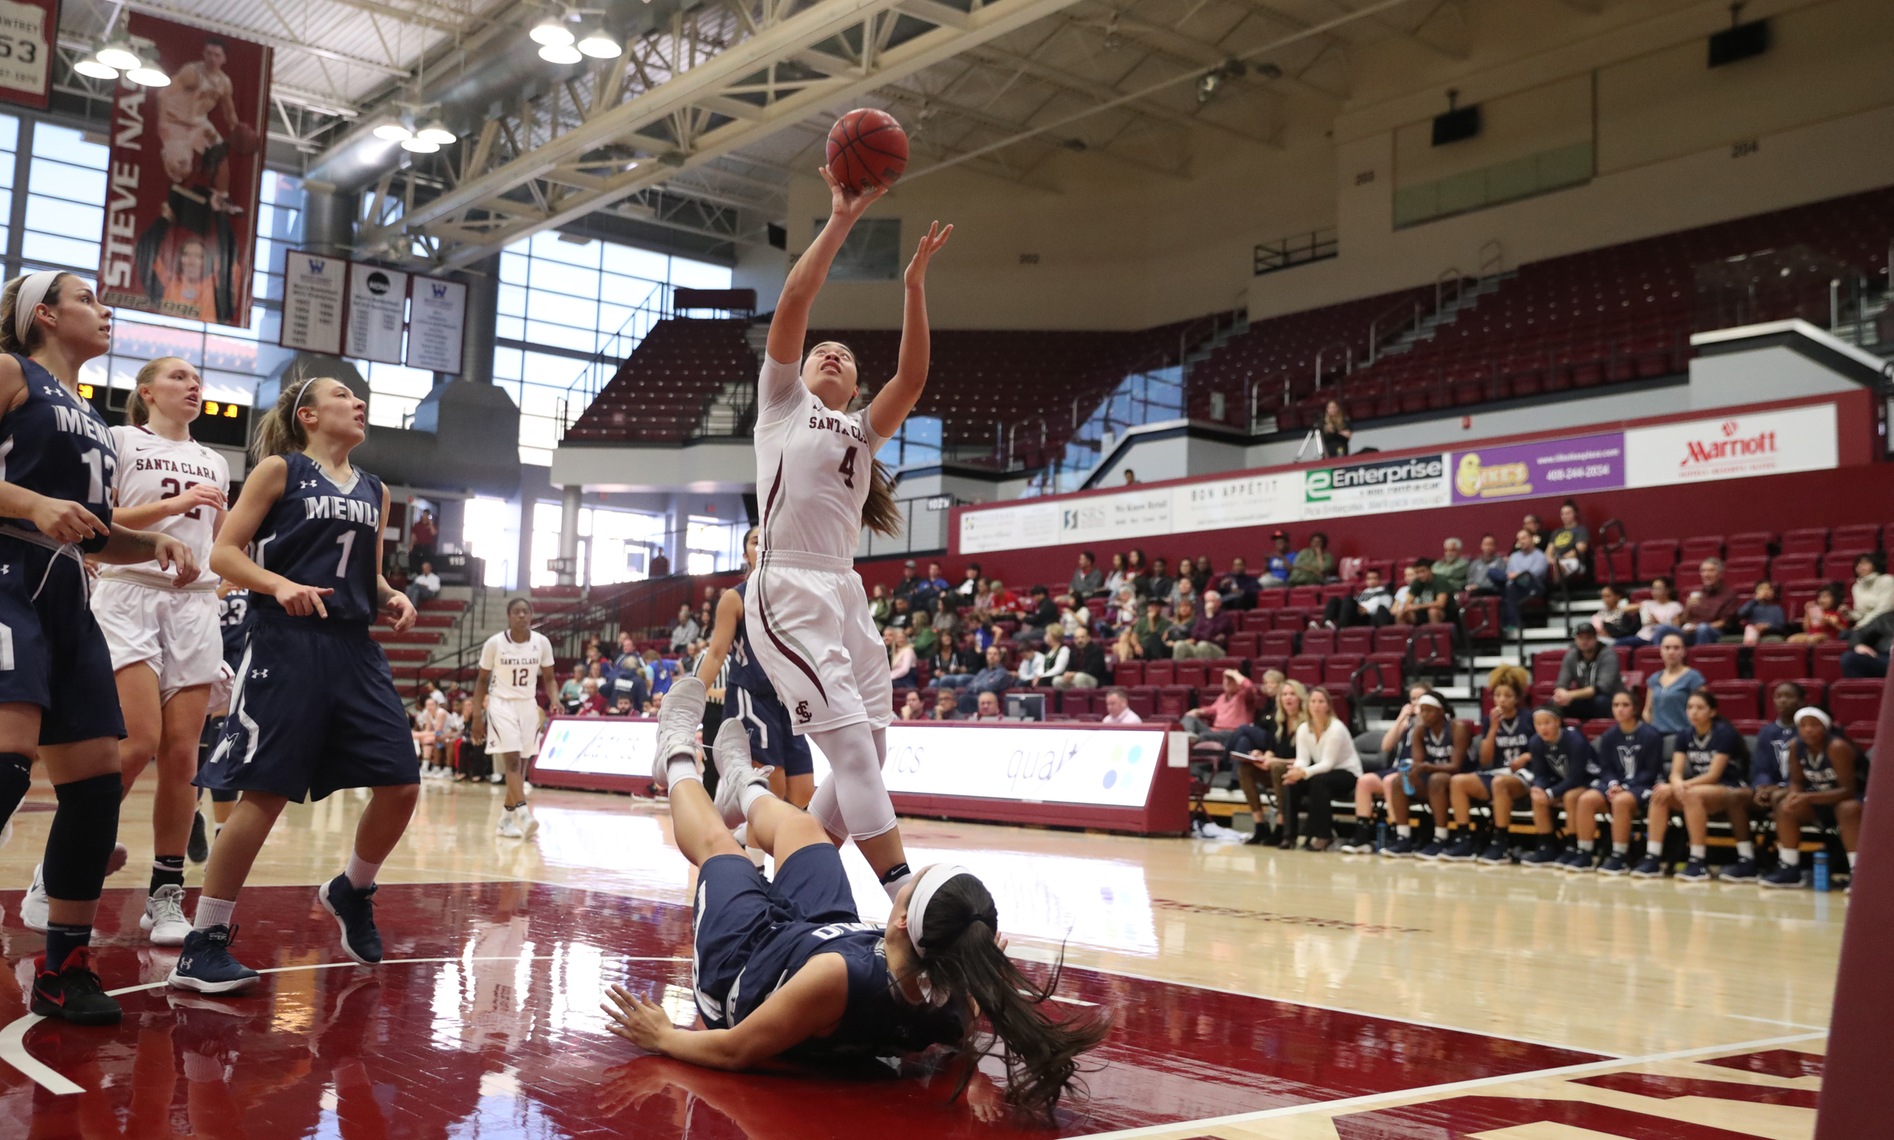
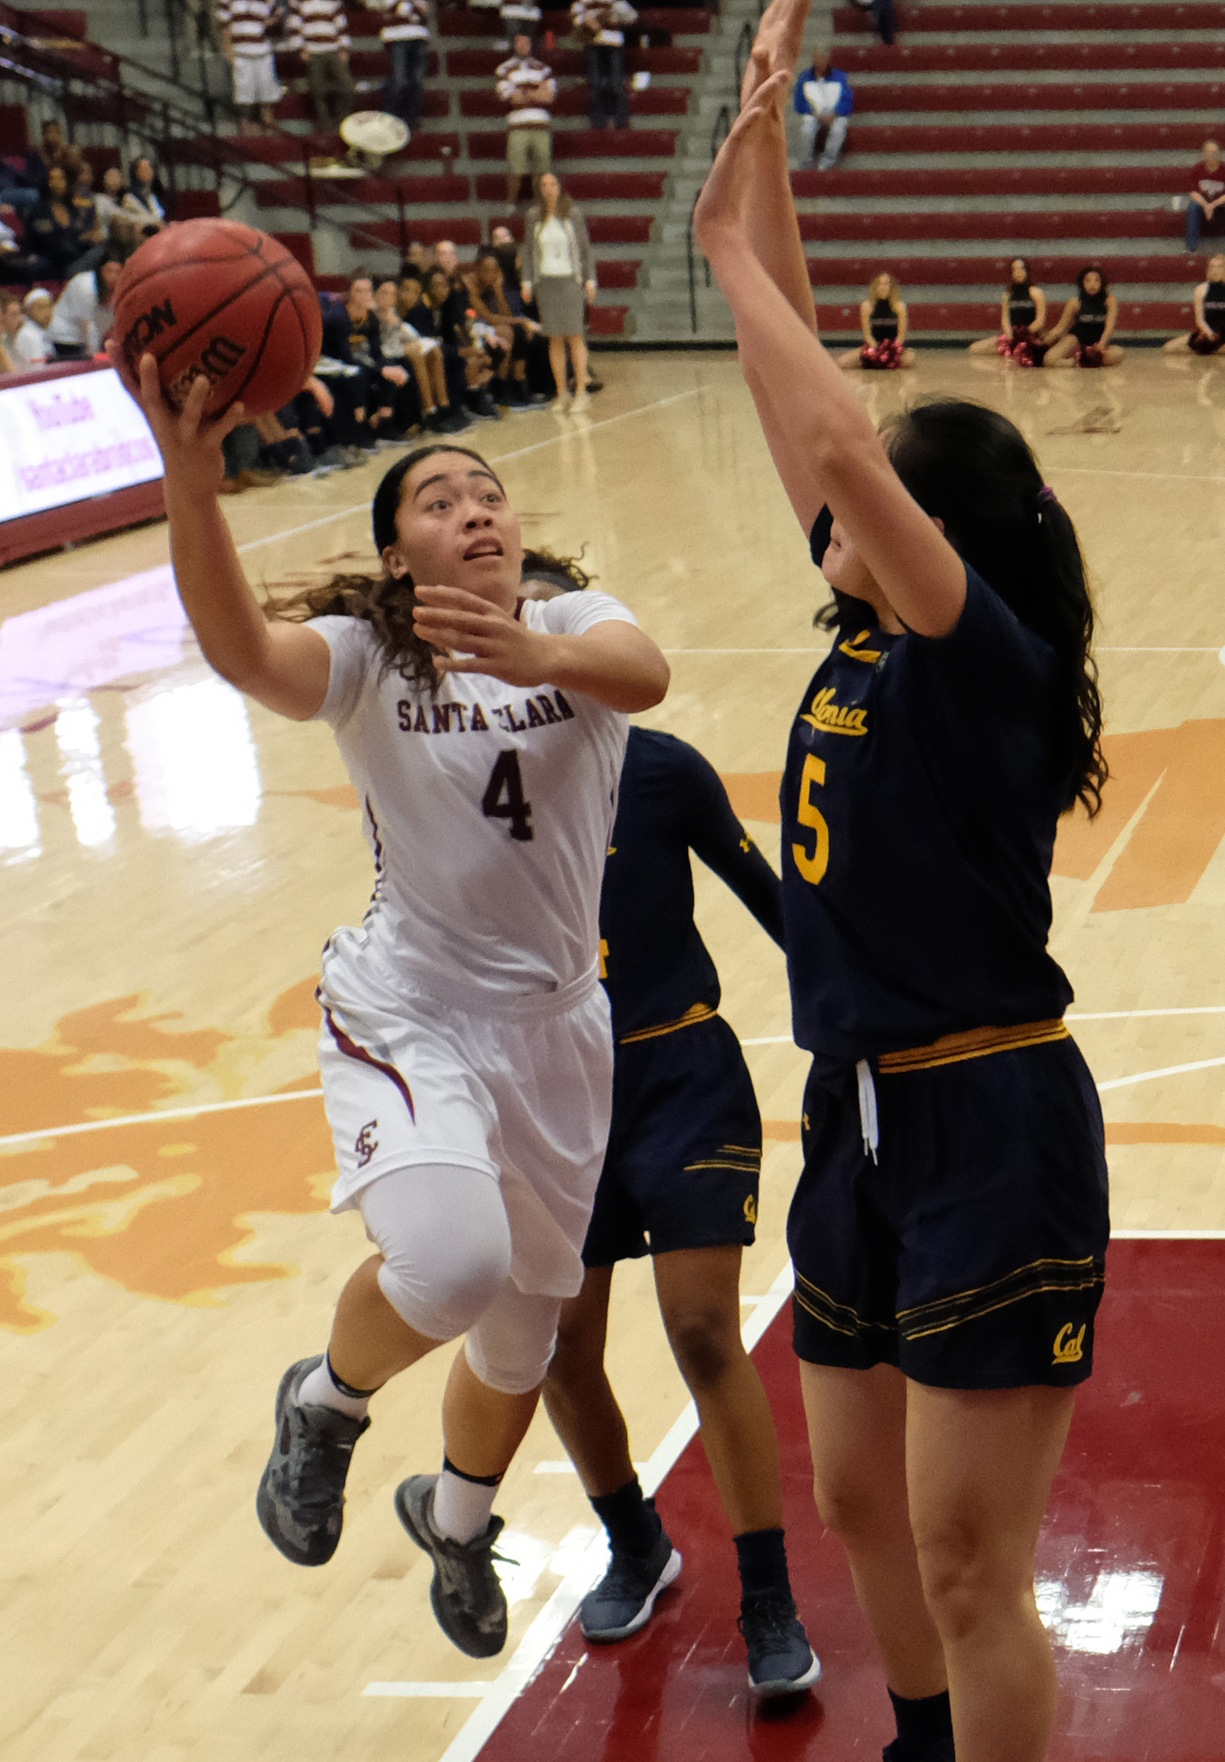
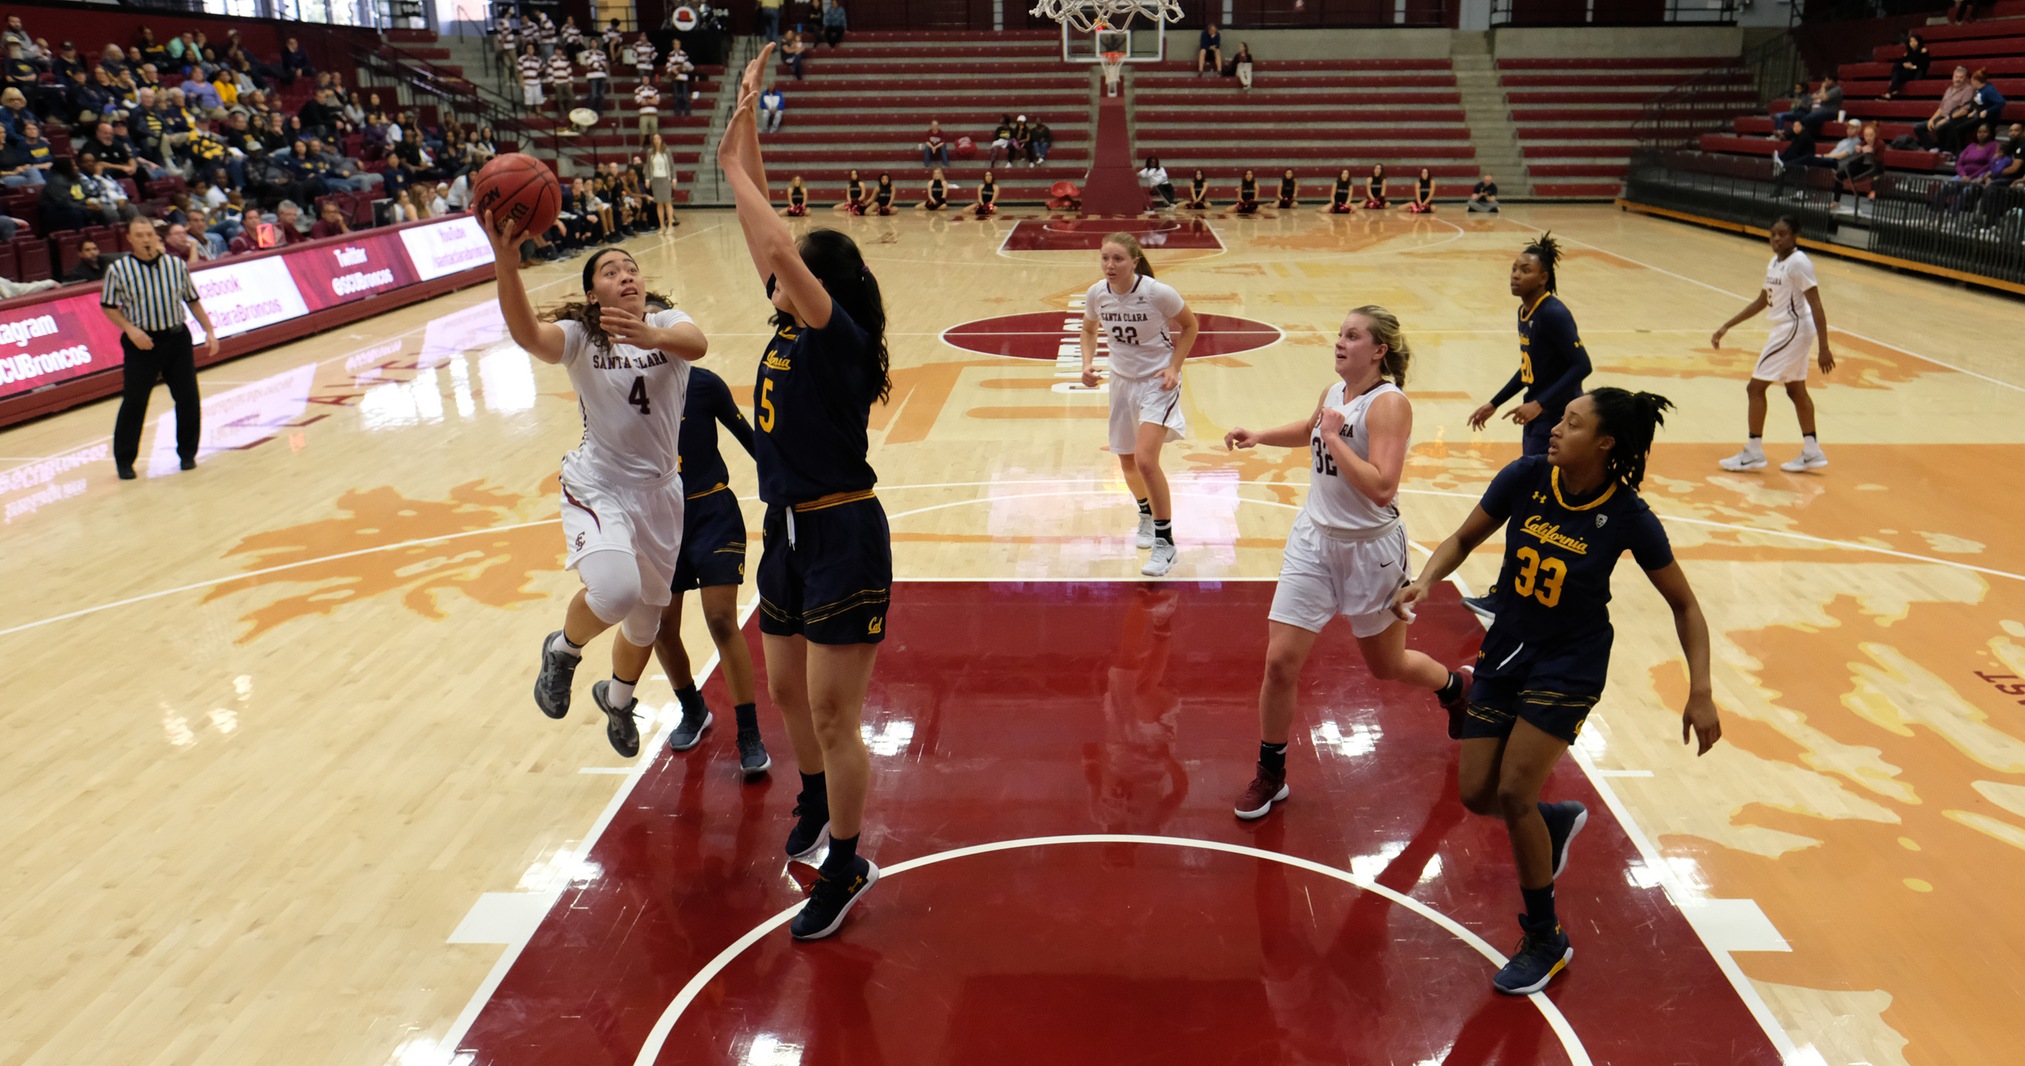
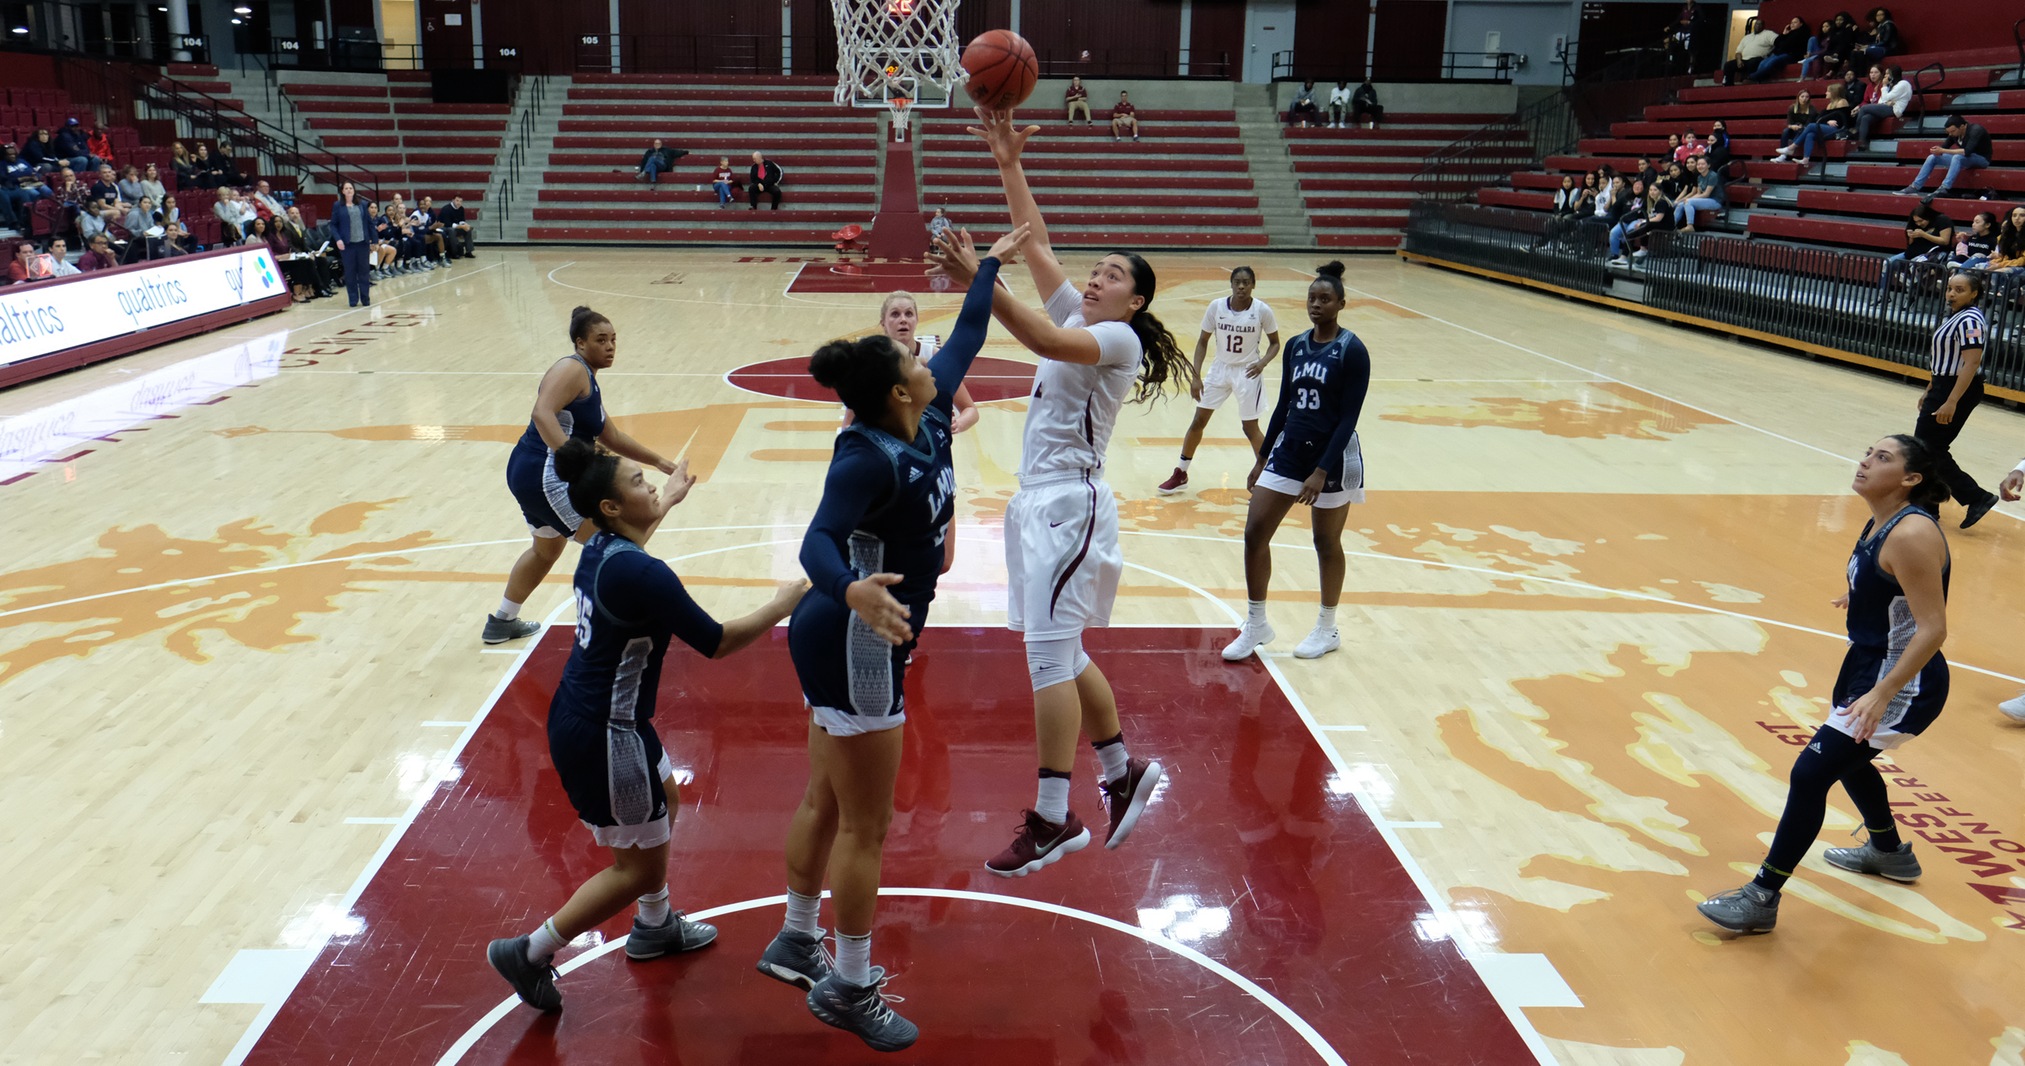
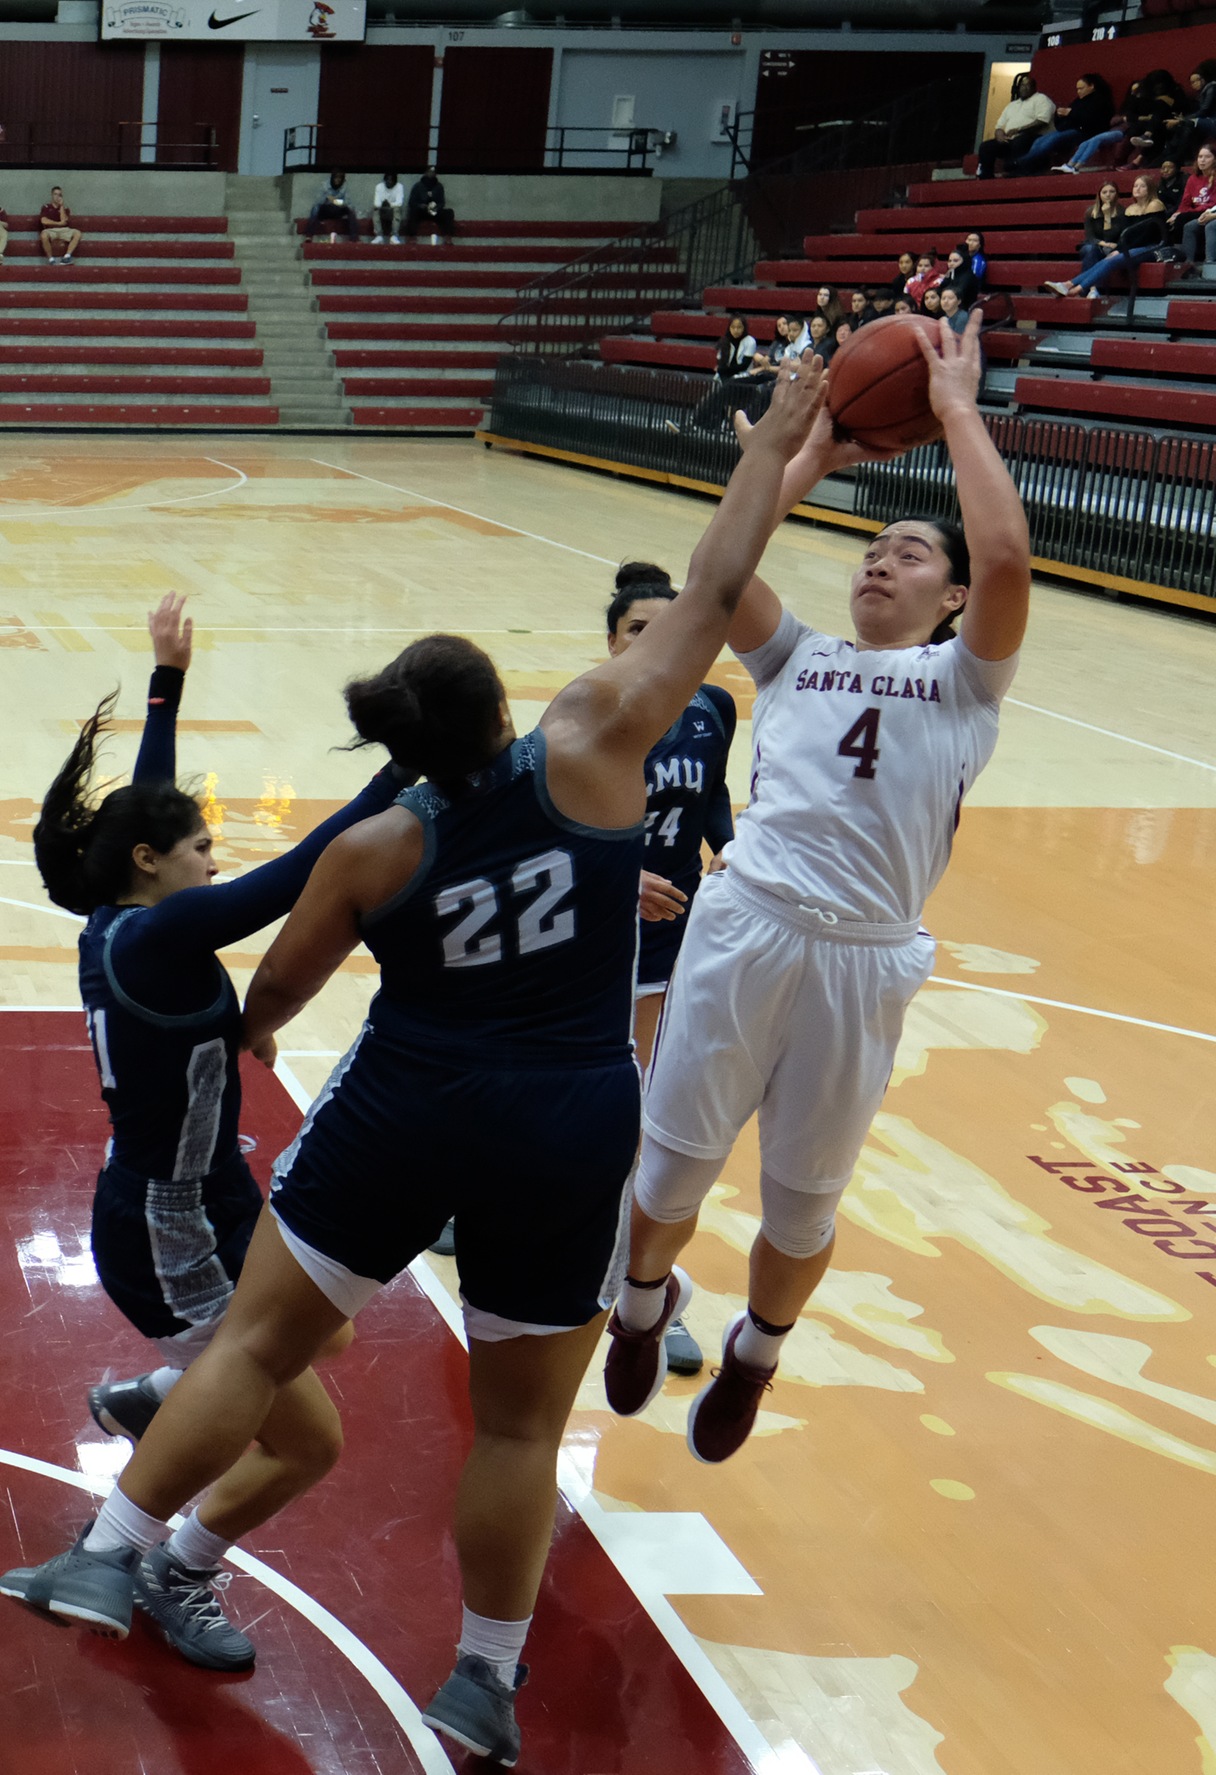
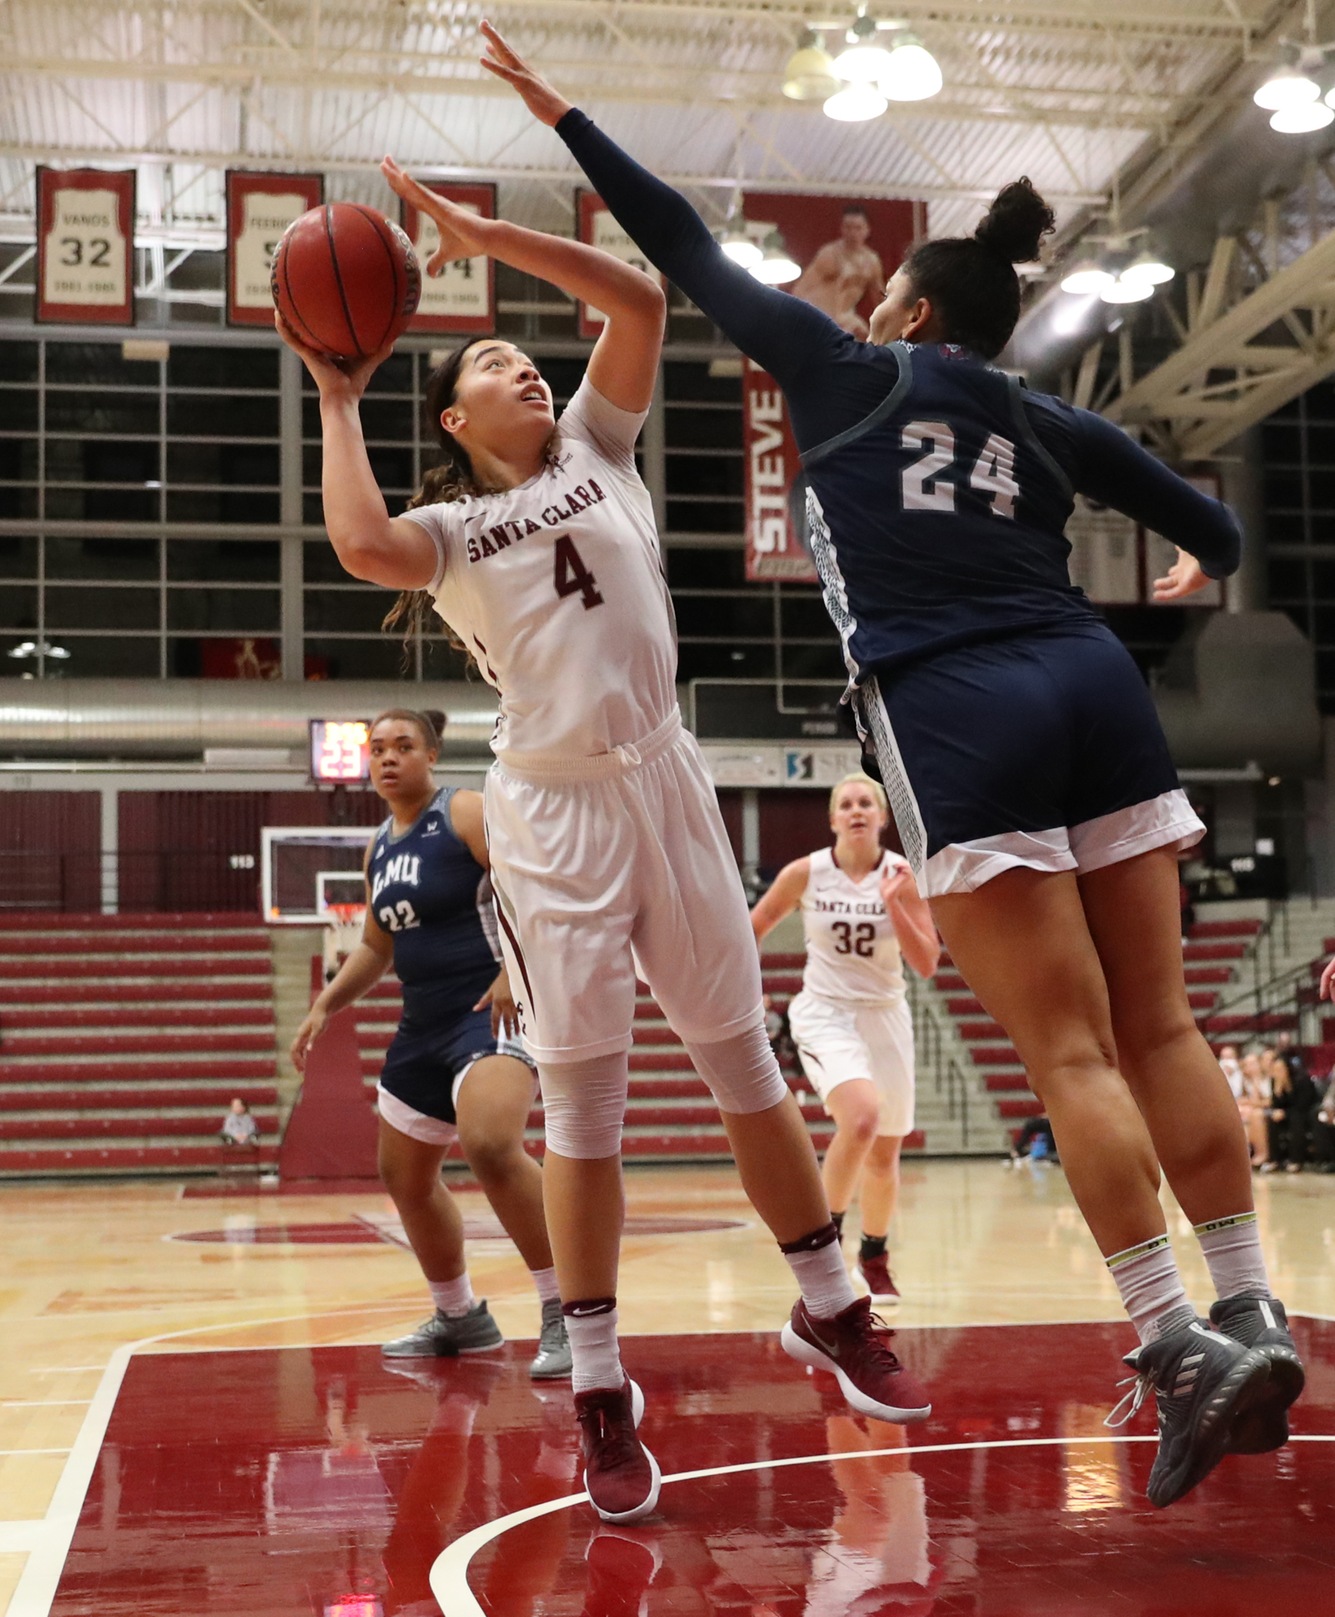
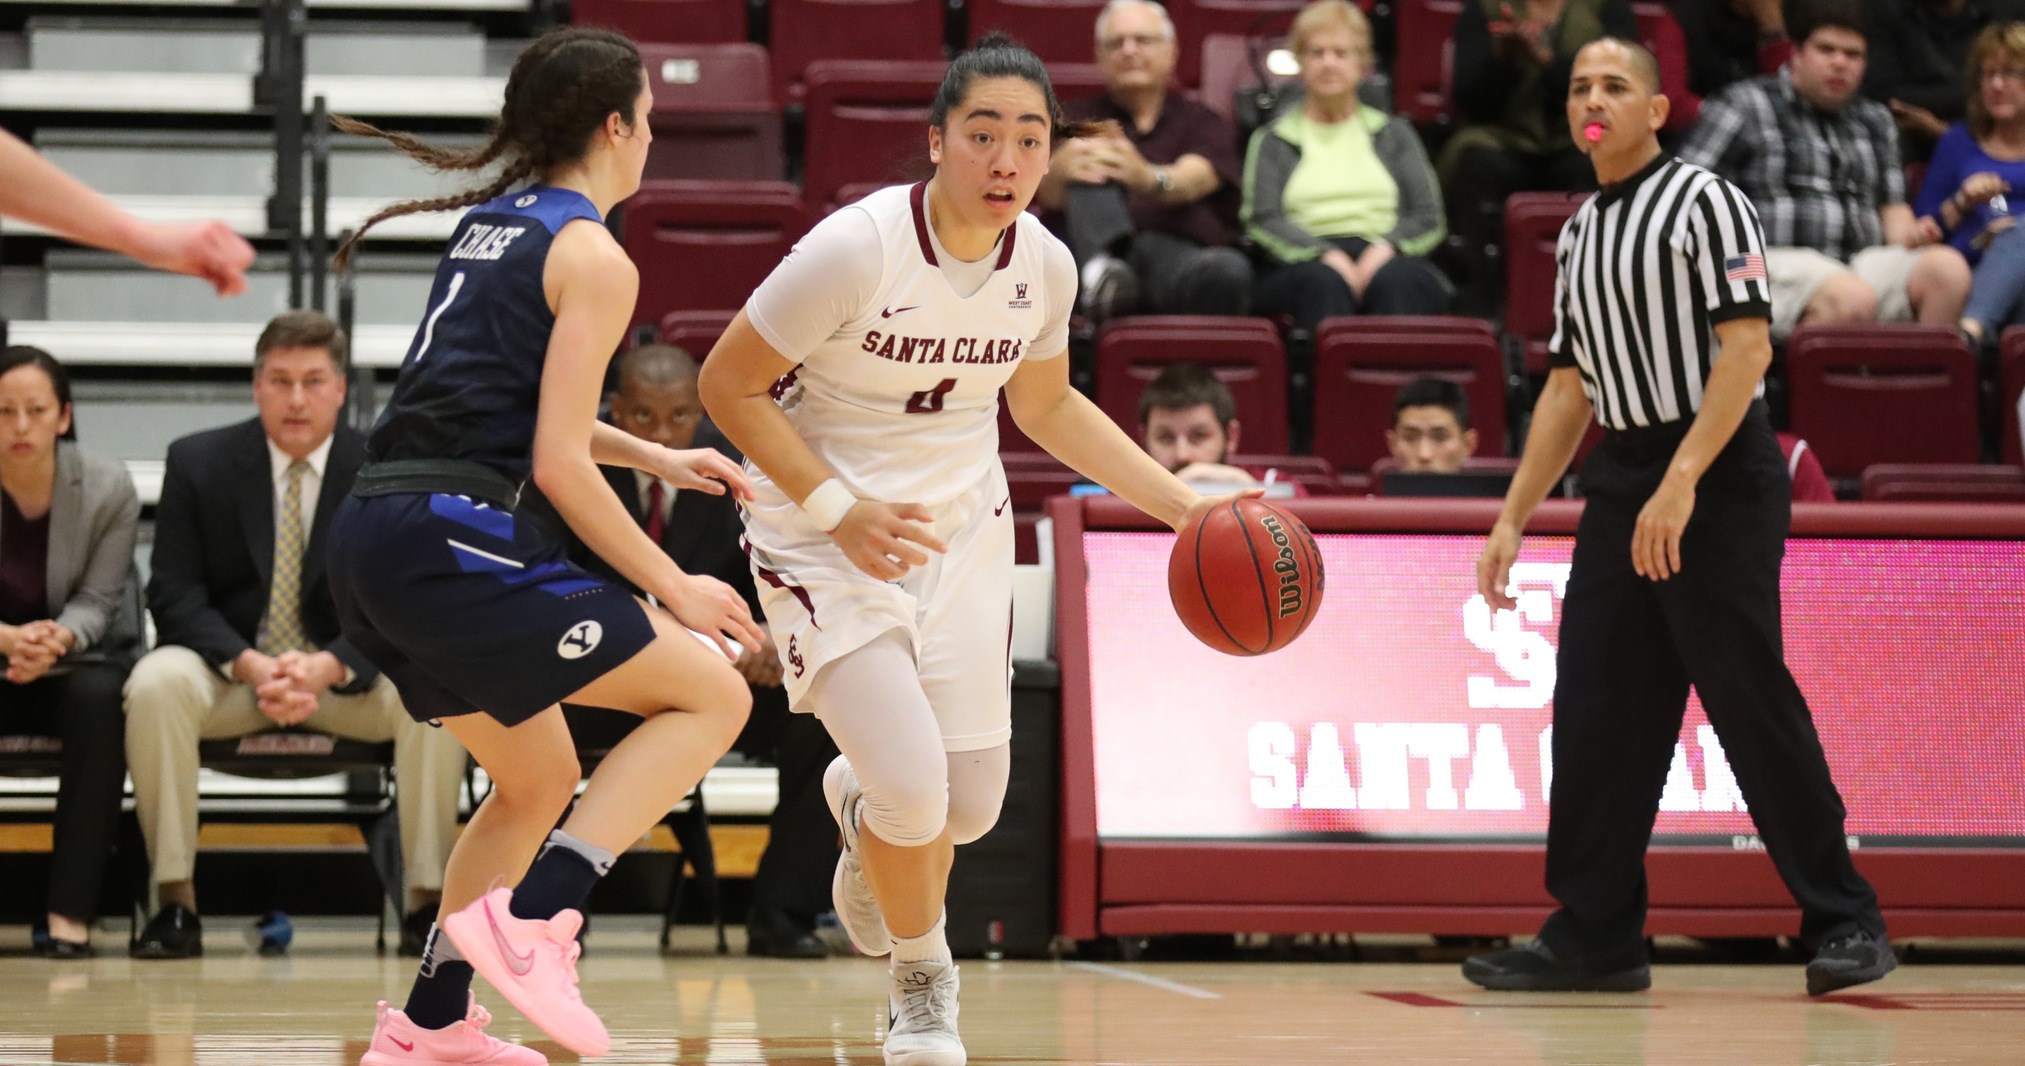
JUNIOR 2017-18: Appeared in all 30 games and made 27 starts … finished third on the team in 3-pointers made (28) … averaged 6.4 ppg and 3.3 rpg … scored a career-high 17 and was 9-for-11 from the free throw line against UC Santa Barbara … scored 10 at Illinois-Chicago … scored 13 against Menlo … had a career-high 10 rebounds at Nevada … scored in double-figures four games in a row (LMU, at Portland, at Saint Mary’s, at BYU).
SOPHMORE 2016-17: Saw first action of the season vs. Northwestern … had career-high four rebounds vs. Portland … scored four pts. vs. Pepperdine … had two steals vs. Saint Mary’s … saw 15 minutes of action vs. LMU.
FRESHMAN 2015-16: Appeared in 19 games ... made collegiate debut at Washington ... hit first career three vs. Air Force ... scored 12 pts. on 4 of 6 shooting from beyond the arc vs. Hope International ... scored 10 pts. vs. BYU ... scored 12 pts. vs. San Diego ... scored 11 pts. and hit three 3-pointers at LMU ... missed the rest of the season due to injury.
CLUB: Playedin Sydney for the U18 Bankstown Bruins and was named MVP in 2014 ... averaged 18.0 points per game, 9.0 rebounds per game, and 4.0 steals per game ... NSW CCC team won the All-School Tournament in 2013 ... representative for the New Zealand Tall Ferns National Team in 2014 and the Junior Tall Ferns as well.
PERSONAL: A 2014 House Captain ... hobbies include touch rugby, netball, Pilates, boxing, strength and conditioning, and reading.
| Recent Games | ||
|---|---|---|
| Feb 10 | at San Diego | L, 51-40 |
| Feb 15 | Portland | W, 67-57 |
| Feb 17 | Pacific | W, 57-55 |
| Feb 22 | at Loyola Marymount | L, 64-45 |
| Feb 24 | Saint Mary's | L, 72-51 |
| Mar 1 | vs. Pepperdine | L, 74-63 |
| Statistics category | Overall | Conf | ||
|---|---|---|---|---|
| Games | 30 | 18 | ||
| Games started | 25 | 15 | ||
| Minutes | 710 | 412 | ||
| Minutes per game | 23.7 | 22.9 | ||
| FG | 63-191 | 37-113 | ||
| FG Pct | 33.0 | 32.7 | ||
| 3PT | 28-99 | 21-67 | ||
| 3PT Pct | 28.3 | 31.3 | ||
| FT | 39-54 | 19-26 | ||
| FT Pct | 72.2 | 73.1 | ||
| Off rebounds | 25 | 13 | ||
| Def rebounds | 75 | 35 | ||
| Total rebounds | 100 | 48 | ||
| Rebounds per game | 3.3 | 2.7 | ||
| Personal fouls | 69 | 40 | ||
| Disqualifications | - | - | ||
| Assists | 27 | 9 | ||
| Turnovers | 45 | 25 | ||
| Assist to turnover ratio | 0.6 | 0.4 | ||
| Steals | 23 | 11 | ||
| Blocks | 4 | 3 | ||
| Points | 193 | 114 | ||
| Points per game | 6.4 | 6.3 | ||
| Points per 40 min | 10.9 | 11.1 | ||
| Date | Opponent | Score | gs | min | fg | pct | 3pt | pct | ft | pct | pts |
|---|---|---|---|---|---|---|---|---|---|---|---|
| Nov 1 | UC Santa Cruz | W, 71-32 | - | - | - | - | - | - | - | - | - |
| Nov 6 | San Francisco State University | W, 74-39 | - | - | - | - | - | - | - | - | - |
| Nov 11 | Cal St. Fullerton | L, 73-69 | 1 | 19 | 0-3 | 0.0 | 0-2 | 0.0 | 2-2 | 100.0 | 2 |
| Nov 14 | UC Santa Barbara | W, 68-63 | - | 33 | 4-8 | 50.0 | 0-1 | 0.0 | 9-11 | 81.8 | 17 |
| Nov 17 | USC | L, 64-43 | - | 28 | 2-5 | 40.0 | 1-3 | 33.3 | 0-0 | - | 5 |
| Nov 22 | at Northwestern | L, 57-47 | 1 | 24 | 0-5 | 0.0 | 0-3 | 0.0 | 2-2 | 100.0 | 2 |
| Nov 25 | at University of Illinois at Chicago | W, 45-36 | 1 | 27 | 3-8 | 37.5 | 2-5 | 40.0 | 2-2 | 100.0 | 10 |
| Nov 28 | San José State | L, 71-66 | 1 | 22 | 1-6 | 16.7 | 0-3 | 0.0 | 0-0 | - | 2 |
| Dec 2 | California | L, 79-41 | 1 | 27 | 3-5 | 60.0 | 1-2 | 50.0 | 0-0 | - | 7 |
| Dec 10 | Menlo | W, 104-61 | 1 | 26 | 5-15 | 33.3 | 2-4 | 50.0 | 1-2 | 50.0 | 13 |
| Dec 14 | at San Diego State University | W, 48-34 | 1 | 25 | 3-9 | 33.3 | 1-4 | 25.0 | 0-0 | - | 7 |
| Dec 16 | at Nevada | L, 52-41 | 1 | 27 | 1-5 | 20.0 | 0-2 | 0.0 | 3-6 | 50.0 | 5 |
| Dec 21 | at Grand Canyon | L, 39-38 | 1 | 23 | 2-4 | 50.0 | 0-2 | 0.0 | 0-0 | - | 4 |
| Dec 28 | at Pepperdine | L, 56-55 | - | 23 | 1-5 | 20.0 | 1-2 | 50.0 | 4-5 | 80.0 | 7 |
| Dec 30 | Gonzaga | L, 63-51 | - | 18 | 1-3 | 33.3 | 1-3 | 33.3 | 0-0 | - | 3 |
| Jan 4 | Loyola Marymount | L, 65-51 | - | 28 | 4-9 | 44.4 | 1-4 | 25.0 | 2-4 | 50.0 | 11 |
| Jan 6 | at Portland | W, 50-43 | 1 | 31 | 3-8 | 37.5 | 1-3 | 33.3 | 5-7 | 71.4 | 12 |
| Jan 11 | at Saint Mary's | L, 59-46 | 1 | 33 | 3-16 | 18.8 | 2-7 | 28.6 | 4-4 | 100.0 | 12 |
| Jan 13 | at BYU | L, 65-47 | 1 | 32 | 4-8 | 50.0 | 0-3 | 0.0 | 2-2 | 100.0 | 10 |
| Jan 18 | San Francisco | L, 58-54 | 1 | 25 | 3-9 | 33.3 | 2-5 | 40.0 | 0-0 | - | 8 |
| Jan 20 | at Gonzaga | L, 71-44 | 1 | 23 | 3-6 | 50.0 | 3-4 | 75.0 | 0-0 | - | 9 |
| Jan 25 | San Diego | W, 59-50 | 1 | 18 | 1-7 | 14.3 | 0-4 | 0.0 | 0-0 | - | 2 |
| Jan 27 | Pepperdine | W, 54-50 | 1 | 21 | 3-6 | 50.0 | 3-5 | 60.0 | 0-2 | 0.0 | 9 |
| Feb 1 | at Pacific | L, 55-37 | 1 | 16 | 1-5 | 20.0 | 1-5 | 20.0 | 0-0 | - | 3 |
| Feb 3 | at San Francisco | L, 64-47 | 1 | 18 | 1-5 | 20.0 | 1-4 | 25.0 | 2-2 | 100.0 | 5 |
| Feb 8 | BYU | L, 55-34 | 1 | 24 | 2-6 | 33.3 | 2-6 | 33.3 | 0-0 | - | 6 |
| Feb 10 | at San Diego | L, 51-40 | 1 | 25 | 1-3 | 33.3 | 0-2 | 0.0 | 0-0 | - | 2 |
| Feb 15 | Portland | W, 67-57 | 1 | 26 | 4-6 | 66.7 | 1-1 | 100.0 | 0-0 | - | 9 |
| Feb 17 | Pacific | W, 57-55 | 1 | 16 | 0-2 | 0.0 | 0-2 | 0.0 | 0-0 | - | 0 |
| Feb 22 | at Loyola Marymount | L, 64-45 | 1 | 18 | 2-5 | 40.0 | 2-4 | 50.0 | 0-0 | - | 6 |
| Feb 24 | Saint Mary's | L, 72-51 | 1 | 17 | 0-4 | 0.0 | 0-3 | 0.0 | 0-0 | - | 0 |
| Mar 1 | vs. Pepperdine | L, 74-63 | 1 | 17 | 2-5 | 40.0 | 0-1 | 0.0 | 1-3 | 33.3 | 5 |
| Date | Opponent | Score | gs | min | off | def | reb | ast | to | a/to | stl | blk | pf | dq |
|---|---|---|---|---|---|---|---|---|---|---|---|---|---|---|
| Nov 1 | UC Santa Cruz | W, 71-32 | - | - | - | - | - | - | - | - | - | - | - | - |
| Nov 6 | San Francisco State University | W, 74-39 | - | - | - | - | - | - | - | - | - | - | - | - |
| Nov 11 | Cal St. Fullerton | L, 73-69 | 1 | 19 | 2 | 2 | 4 | 3 | 2 | 1.5 | 0 | 0 | 4 | - |
| Nov 14 | UC Santa Barbara | W, 68-63 | - | 33 | 3 | 2 | 5 | 2 | 2 | 1.0 | 1 | 0 | 3 | - |
| Nov 17 | USC | L, 64-43 | - | 28 | 0 | 1 | 1 | 2 | 2 | 1.0 | 1 | 0 | 3 | - |
| Nov 22 | at Northwestern | L, 57-47 | 1 | 24 | 1 | 3 | 4 | 1 | 3 | 0.3 | 1 | 0 | 3 | - |
| Nov 25 | at University of Illinois at Chicago | W, 45-36 | 1 | 27 | 1 | 2 | 3 | 0 | 1 | 0.0 | 2 | 0 | 3 | - |
| Nov 28 | San José State | L, 71-66 | 1 | 22 | 0 | 5 | 5 | 4 | 1 | 4.0 | 0 | 0 | 4 | - |
| Dec 2 | California | L, 79-41 | 1 | 27 | 0 | 4 | 4 | 1 | 2 | 0.5 | 0 | 1 | 1 | - |
| Dec 10 | Menlo | W, 104-61 | 1 | 26 | 0 | 4 | 4 | 3 | 2 | 1.5 | 1 | 0 | 2 | - |
| Dec 14 | at San Diego State University | W, 48-34 | 1 | 25 | 1 | 9 | 10 | 0 | 1 | 0.0 | 1 | 0 | 3 | - |
| Dec 16 | at Nevada | L, 52-41 | 1 | 27 | 2 | 4 | 6 | 1 | 1 | 1.0 | 4 | 0 | 0 | - |
| Dec 21 | at Grand Canyon | L, 39-38 | 1 | 23 | 0 | 3 | 3 | 1 | 2 | 0.5 | 0 | 0 | 2 | - |
| Dec 28 | at Pepperdine | L, 56-55 | - | 23 | 1 | 6 | 7 | 0 | 3 | 0.0 | 0 | 0 | 4 | - |
| Dec 30 | Gonzaga | L, 63-51 | - | 18 | 2 | 2 | 4 | 0 | 1 | 0.0 | 1 | 1 | 1 | - |
| Jan 4 | Loyola Marymount | L, 65-51 | - | 28 | 1 | 2 | 3 | 1 | 2 | 0.5 | 1 | 1 | 4 | - |
| Jan 6 | at Portland | W, 50-43 | 1 | 31 | 2 | 3 | 5 | 0 | 3 | 0.0 | 1 | 0 | 3 | - |
| Jan 11 | at Saint Mary's | L, 59-46 | 1 | 33 | 2 | 2 | 4 | 1 | 2 | 0.5 | 0 | 0 | 3 | - |
| Jan 13 | at BYU | L, 65-47 | 1 | 32 | 0 | 1 | 1 | 0 | 1 | 0.0 | 2 | 0 | 4 | - |
| Jan 18 | San Francisco | L, 58-54 | 1 | 25 | 1 | 1 | 2 | 1 | 1 | 1.0 | 0 | 0 | 3 | - |
| Jan 20 | at Gonzaga | L, 71-44 | 1 | 23 | 1 | 1 | 2 | 0 | 1 | 0.0 | 1 | 0 | 2 | - |
| Jan 25 | San Diego | W, 59-50 | 1 | 18 | 2 | 2 | 4 | 0 | 0 | - | 0 | 0 | 0 | - |
| Jan 27 | Pepperdine | W, 54-50 | 1 | 21 | 0 | 2 | 2 | 0 | 0 | - | 0 | 0 | 0 | - |
| Feb 1 | at Pacific | L, 55-37 | 1 | 16 | 0 | 1 | 1 | 0 | 3 | 0.0 | 1 | 0 | 0 | - |
| Feb 3 | at San Francisco | L, 64-47 | 1 | 18 | 0 | 2 | 2 | 0 | 1 | 0.0 | 0 | 0 | 1 | - |
| Feb 8 | BYU | L, 55-34 | 1 | 24 | 0 | 1 | 1 | 0 | 2 | 0.0 | 0 | 0 | 2 | - |
| Feb 10 | at San Diego | L, 51-40 | 1 | 25 | 0 | 2 | 2 | 2 | 0 | - | 1 | 0 | 3 | - |
| Feb 15 | Portland | W, 67-57 | 1 | 26 | 0 | 3 | 3 | 2 | 1 | 2.0 | 1 | 0 | 4 | - |
| Feb 17 | Pacific | W, 57-55 | 1 | 16 | 0 | 1 | 1 | 1 | 2 | 0.5 | 0 | 0 | 2 | - |
| Feb 22 | at Loyola Marymount | L, 64-45 | 1 | 18 | 1 | 2 | 3 | 1 | 2 | 0.5 | 1 | 0 | 1 | - |
| Feb 24 | Saint Mary's | L, 72-51 | 1 | 17 | 0 | 1 | 1 | 0 | 0 | - | 1 | 1 | 3 | - |
| Mar 1 | vs. Pepperdine | L, 74-63 | 1 | 17 | 2 | 1 | 3 | 0 | 1 | 0.0 | 1 | 0 | 1 | - |
| gp | gs | min/g | fg/g | pct | 3pt/g | pct | ft/g | pct | ppg | |
|---|---|---|---|---|---|---|---|---|---|---|
| 2015-16 | 19 | - | 13.6 | 1.4-4.2 | 32.9 | 0.9-3.1 | 30.5 | 0.5-0.6 | 75.0 | 4.2 |
| 2016-17 | 22 | - | 7.0 | 0.1-0.9 | 10.0 | 0.1-0.7 | 13.3 | 0.1-0.2 | 50.0 | 0.4 |
| 2017-18 | 30 | 25 | 23.7 | 2.1-6.4 | 33.0 | 0.9-3.3 | 28.3 | 1.3-1.8 | 72.2 | 6.4 |
| 2018-19 | 31 | 1 | 10.0 | 0.6-2.0 | 29.5 | 0.2-1.1 | 17.1 | 0.1-0.2 | 57.1 | 1.5 |
| Total | 102 | 26 | 14.0 | 1.1-3.4 | 31.1 | 0.5-2.0 | 26.0 | 0.5-0.8 | 70.1 | 3.2 |
| gp | gs | min/g | fg/40 | pct | 3pt/40 | pct | ft/40 | pct | pts/40 | |
|---|---|---|---|---|---|---|---|---|---|---|
| 2015-16 | 19 | - | 13.6 | 4.0-12.2 | 32.9 | 2.8-9.1 | 30.5 | 1.4-1.9 | 75.0 | 12.2 |
| 2016-17 | 22 | - | 7.0 | 0.5-5.2 | 10.0 | 0.5-3.9 | 13.3 | 0.5-1.0 | 50.0 | 2.1 |
| 2017-18 | 30 | 25 | 23.7 | 3.5-10.8 | 33.0 | 1.6-5.6 | 28.3 | 2.2-3.0 | 72.2 | 10.9 |
| 2018-19 | 31 | 1 | 10.0 | 2.3-7.9 | 29.5 | 0.8-4.5 | 17.1 | 0.5-0.9 | 57.1 | 5.9 |
| Total | 102 | 26 | 14.0 | 3.0-9.8 | 31.1 | 1.5-5.8 | 26.0 | 1.5-2.2 | 70.1 | 9.1 |
| gp | gs | mpg | off/g | def/g | reb/g | pf/g | dq/g | ast/g | to/g | a/to | stl/g | blk/g | |
|---|---|---|---|---|---|---|---|---|---|---|---|---|---|
| 2015-16 | 19 | - | 13.6 | 0.3 | 1.3 | 1.6 | 1.4 | 0.0 | 0.2 | 1.0 | 0.2 | 0.4 | 0.1 |
| 2016-17 | 22 | - | 7.0 | 0.3 | 0.8 | 1.1 | 0.5 | 0.0 | 0.2 | 0.3 | 0.7 | 0.5 | 0.0 |
| 2017-18 | 30 | 25 | 23.7 | 0.8 | 2.5 | 3.3 | 2.3 | - | 0.9 | 1.5 | 0.6 | 0.8 | 0.1 |
| 2018-19 | 31 | 1 | 10.0 | 0.8 | 1.8 | 2.6 | 1.3 | 0.0 | 0.6 | 0.6 | 1.0 | 0.4 | 0.0 |
| Total | 102 | 26 | 14.0 | 0.6 | 1.7 | 2.3 | 1.5 | 0.0 | 0.5 | 0.9 | 0.6 | 0.5 | 0.1 |
| gp | gs | mpg | off/40 | def/40 | reb/40 | pf/40 | dq/40 | ast/40 | to/40 | a/to | stl/40 | blk/40 | |
|---|---|---|---|---|---|---|---|---|---|---|---|---|---|
| 2015-16 | 19 | - | 13.6 | 0.9 | 3.7 | 4.6 | 4.0 | 0.0 | 0.6 | 2.9 | 0.2 | 1.2 | 0.2 |
| 2016-17 | 22 | - | 7.0 | 1.8 | 4.4 | 6.3 | 3.1 | 0.0 | 1.0 | 1.6 | 0.7 | 2.9 | 0.0 |
| 2017-18 | 30 | 25 | 23.7 | 1.4 | 4.2 | 5.6 | 3.9 | 0.0 | 1.5 | 2.5 | 0.6 | 1.3 | 0.2 |
| 2018-19 | 31 | 1 | 10.0 | 3.1 | 7.2 | 10.3 | 5.3 | 0.1 | 2.6 | 2.6 | 1.0 | 1.5 | 0.1 |
| Total | 102 | 26 | 14.0 | 1.7 | 4.8 | 6.5 | 4.1 | 0.0 | 1.5 | 2.5 | 0.6 | 1.5 | 0.2 |
| gp | gs | min/g | fg/g | pct | 3pt/g | pct | ft/g | pct | ppg | |
|---|---|---|---|---|---|---|---|---|---|---|
| Total | 30 | 25 | 23.7 | 2.1-6.4 | 33.0 | 0.9-3.3 | 28.3 | 1.3-1.8 | 72.2 | 6.4 |
| Conference | 18 | 15 | 22.9 | 2.1-6.3 | 32.7 | 1.2-3.7 | 31.3 | 1.1-1.4 | 73.1 | 6.3 |
| Exhibition | - | - | - | 0.0-0.0 | - | 0.0-0.0 | - | 0.0-0.0 | - | - |
- | ||||||||||
| Home | 15 | 11 | 23.2 | 2.2-6.3 | 35.1 | 0.9-3.2 | 29.2 | 0.9-1.4 | 66.7 | 6.3 |
| Away | 14 | 13 | 24.6 | 2.0-6.6 | 30.4 | 1.0-3.6 | 28.0 | 1.7-2.1 | 80.0 | 6.7 |
| Neutral | 1 | 1 | 17.0 | 2.0-5.0 | 40.0 | 0.0-1.0 | 0.0 | 1.0-3.0 | 33.3 | 5.0 |
- | ||||||||||
| Wins | 9 | 8 | 24.8 | 2.9-7.7 | 37.7 | 1.1-3.2 | 34.5 | 1.9-2.7 | 70.8 | 8.8 |
| Losses | 21 | 17 | 23.2 | 1.8-5.8 | 30.3 | 0.9-3.3 | 25.7 | 1.0-1.4 | 73.3 | 5.4 |
- | ||||||||||
| November | 6 | 4 | 25.5 | 1.7-5.8 | 28.6 | 0.5-2.8 | 17.6 | 2.5-2.8 | 88.2 | 6.3 |
| December | 7 | 5 | 24.1 | 2.3-6.6 | 34.8 | 0.9-2.7 | 31.6 | 1.1-1.9 | 61.5 | 6.6 |
| January | 8 | 7 | 26.4 | 3.0-8.6 | 34.8 | 1.5-4.4 | 34.3 | 1.6-2.4 | 68.4 | 9.1 |
| February | 8 | 8 | 20.0 | 1.4-4.5 | 30.6 | 0.9-3.4 | 25.9 | 0.2-0.2 | 100.0 | 3.9 |
| March | 1 | 1 | 17.0 | 2.0-5.0 | 40.0 | 0.0-1.0 | 0.0 | 1.0-3.0 | 33.3 | 5.0 |
| gp | gs | min | fg | pct | 3pt | pct | ft | pct | pts | |
|---|---|---|---|---|---|---|---|---|---|---|
| Total | 30 | 25 | 710 | 63-191 | 33.0 | 28-99 | 28.3 | 39-54 | 72.2 | 193 |
| Conference | 18 | 15 | 412 | 37-113 | 32.7 | 21-67 | 31.3 | 19-26 | 73.1 | 114 |
| Exhibition | - | - | - | 0-0 | - | 0-0 | - | 0-0 | - | 0 |
- | ||||||||||
| Home | 15 | 11 | 348 | 33-94 | 35.1 | 14-48 | 29.2 | 14-21 | 66.7 | 94 |
| Away | 14 | 13 | 345 | 28-92 | 30.4 | 14-50 | 28.0 | 24-30 | 80.0 | 94 |
| Neutral | 1 | 1 | 17 | 2-5 | 40.0 | 0-1 | 0.0 | 1-3 | 33.3 | 5 |
- | ||||||||||
| Wins | 9 | 8 | 223 | 26-69 | 37.7 | 10-29 | 34.5 | 17-24 | 70.8 | 79 |
| Losses | 21 | 17 | 487 | 37-122 | 30.3 | 18-70 | 25.7 | 22-30 | 73.3 | 114 |
- | ||||||||||
| November | 6 | 4 | 153 | 10-35 | 28.6 | 3-17 | 17.6 | 15-17 | 88.2 | 38 |
| December | 7 | 5 | 169 | 16-46 | 34.8 | 6-19 | 31.6 | 8-13 | 61.5 | 46 |
| January | 8 | 7 | 211 | 24-69 | 34.8 | 12-35 | 34.3 | 13-19 | 68.4 | 73 |
| February | 8 | 8 | 160 | 11-36 | 30.6 | 7-27 | 25.9 | 2-2 | 100.0 | 31 |
| March | 1 | 1 | 17 | 2-5 | 40.0 | 0-1 | 0.0 | 1-3 | 33.3 | 5 |
| gp | gs | min/g | fg/40 | pct | 3pt/40 | pct | ft/40 | pct | pts/40 | |
|---|---|---|---|---|---|---|---|---|---|---|
| Total | 30 | 25 | 23.7 | 3.5-10.8 | 33.0 | 1.6-5.6 | 28.3 | 2.2-3.0 | 72.2 | 10.9 |
| Conference | 18 | 15 | 22.9 | 3.6-11.0 | 32.7 | 2.0-6.5 | 31.3 | 1.8-2.5 | 73.1 | 11.1 |
| Exhibition | - | - | - | 0.0-0.0 | - | 0.0-0.0 | - | 0.0-0.0 | - | - |
- | ||||||||||
| Home | 15 | 11 | 23.2 | 3.8-10.8 | 35.1 | 1.6-5.5 | 29.2 | 1.6-2.4 | 66.7 | 10.8 |
| Away | 14 | 13 | 24.6 | 3.2-10.7 | 30.4 | 1.6-5.8 | 28.0 | 2.8-3.5 | 80.0 | 10.9 |
| Neutral | 1 | 1 | 17.0 | 4.7-11.8 | 40.0 | 0.0-2.4 | 0.0 | 2.4-7.1 | 33.3 | 11.8 |
- | ||||||||||
| Wins | 9 | 8 | 24.8 | 4.7-12.4 | 37.7 | 1.8-5.2 | 34.5 | 3.0-4.3 | 70.8 | 14.2 |
| Losses | 21 | 17 | 23.2 | 3.0-10.0 | 30.3 | 1.5-5.7 | 25.7 | 1.8-2.5 | 73.3 | 9.4 |
- | ||||||||||
| November | 6 | 4 | 25.5 | 2.6-9.2 | 28.6 | 0.8-4.4 | 17.6 | 3.9-4.4 | 88.2 | 9.9 |
| December | 7 | 5 | 24.1 | 3.8-10.9 | 34.8 | 1.4-4.5 | 31.6 | 1.9-3.1 | 61.5 | 10.9 |
| January | 8 | 7 | 26.4 | 4.5-13.1 | 34.8 | 2.3-6.6 | 34.3 | 2.5-3.6 | 68.4 | 13.8 |
| February | 8 | 8 | 20.0 | 2.8-9.0 | 30.6 | 1.8-6.8 | 25.9 | 0.5-0.5 | 100.0 | 7.8 |
| March | 1 | 1 | 17.0 | 4.7-11.8 | 40.0 | 0.0-2.4 | 0.0 | 2.4-7.1 | 33.3 | 11.8 |
| gp | gs | mpg | off/g | def/g | reb/g | pf/g | dq/g | ast/g | to/g | a/to | stl/g | blk/g | |
|---|---|---|---|---|---|---|---|---|---|---|---|---|---|
| Total | 30 | 25 | 23.7 | 0.8 | 2.5 | 3.3 | 2.3 | - | 0.9 | 1.5 | 0.6 | 0.8 | 0.1 |
| Conference | 18 | 15 | 22.9 | 0.7 | 1.9 | 2.7 | 2.2 | - | 0.5 | 1.4 | 0.4 | 0.6 | 0.2 |
| Exhibition | - | - | - | - | - | - | - | - | - | - | - | - | - |
- | |||||||||||||
| Home | 15 | 11 | 23.2 | 0.7 | 2.2 | 2.9 | 2.4 | - | 1.3 | 1.3 | 1.0 | 0.5 | 0.3 |
| Away | 14 | 13 | 24.6 | 0.9 | 2.9 | 3.8 | 2.3 | - | 0.5 | 1.7 | 0.3 | 1.1 | 0.0 |
| Neutral | 1 | 1 | 17.0 | 2.0 | 1.0 | 3.0 | 1.0 | - | 0.0 | 1.0 | 0.0 | 1.0 | 0.0 |
- | |||||||||||||
| Wins | 9 | 8 | 24.8 | 1.0 | 3.1 | 4.1 | 2.2 | - | 0.9 | 1.3 | 0.7 | 0.8 | 0.0 |
| Losses | 21 | 17 | 23.2 | 0.8 | 2.2 | 3.0 | 2.3 | - | 0.9 | 1.6 | 0.6 | 0.8 | 0.2 |
- | |||||||||||||
| November | 6 | 4 | 25.5 | 1.2 | 2.5 | 3.7 | 3.3 | - | 2.0 | 1.8 | 1.1 | 0.8 | 0.0 |
| December | 7 | 5 | 24.1 | 0.9 | 4.6 | 5.4 | 1.9 | - | 0.9 | 1.7 | 0.5 | 1.0 | 0.3 |
| January | 8 | 7 | 26.4 | 1.1 | 1.8 | 2.9 | 2.4 | - | 0.4 | 1.3 | 0.3 | 0.6 | 0.1 |
| February | 8 | 8 | 20.0 | 0.1 | 1.6 | 1.8 | 2.0 | - | 0.8 | 1.4 | 0.5 | 0.6 | 0.1 |
| March | 1 | 1 | 17.0 | 2.0 | 1.0 | 3.0 | 1.0 | - | 0.0 | 1.0 | 0.0 | 1.0 | 0.0 |
| gp | gs | min | off | def | reb | pf | dq | ast | to | a/to | stl | blk | |
|---|---|---|---|---|---|---|---|---|---|---|---|---|---|
| Total | 30 | 25 | 710 | 25 | 75 | 100 | 69 | - | 27 | 45 | 0.6 | 23 | 4 |
| Conference | 18 | 15 | 412 | 13 | 35 | 48 | 40 | - | 9 | 25 | 0.4 | 11 | 3 |
| Exhibition | - | - | - | - | - | - | - | - | - | - | - | - | - |
- | |||||||||||||
| Home | 15 | 11 | 348 | 11 | 33 | 44 | 36 | - | 20 | 20 | 1.0 | 7 | 4 |
| Away | 14 | 13 | 345 | 12 | 41 | 53 | 32 | - | 7 | 24 | 0.3 | 15 | 0 |
| Neutral | 1 | 1 | 17 | 2 | 1 | 3 | 1 | - | 0 | 1 | 0.0 | 1 | 0 |
- | |||||||||||||
| Wins | 9 | 8 | 223 | 9 | 28 | 37 | 20 | - | 8 | 12 | 0.7 | 7 | 0 |
| Losses | 21 | 17 | 487 | 16 | 47 | 63 | 49 | - | 19 | 33 | 0.6 | 16 | 4 |
- | |||||||||||||
| November | 6 | 4 | 153 | 7 | 15 | 22 | 20 | - | 12 | 11 | 1.1 | 5 | 0 |
| December | 7 | 5 | 169 | 6 | 32 | 38 | 13 | - | 6 | 12 | 0.5 | 7 | 2 |
| January | 8 | 7 | 211 | 9 | 14 | 23 | 19 | - | 3 | 10 | 0.3 | 5 | 1 |
| February | 8 | 8 | 160 | 1 | 13 | 14 | 16 | - | 6 | 11 | 0.5 | 5 | 1 |
| March | 1 | 1 | 17 | 2 | 1 | 3 | 1 | - | 0 | 1 | 0.0 | 1 | 0 |
| gp | gs | mpg | off/40 | def/40 | reb/40 | pf/40 | dq/40 | ast/40 | to/40 | a/to | stl/40 | blk/40 | |
|---|---|---|---|---|---|---|---|---|---|---|---|---|---|
| Total | 30 | 25 | 23.7 | 1.4 | 4.2 | 5.6 | 3.9 | 0.0 | 1.5 | 2.5 | 0.6 | 1.3 | 0.2 |
| Conference | 18 | 15 | 22.9 | 1.3 | 3.4 | 4.7 | 3.9 | 0.0 | 0.9 | 2.4 | 0.4 | 1.1 | 0.3 |
| Exhibition | - | - | - | - | - | - | - | - | - | - | - | - | - |
- | |||||||||||||
| Home | 15 | 11 | 23.2 | 1.3 | 3.8 | 5.1 | 4.1 | 0.0 | 2.3 | 2.3 | 1.0 | 0.8 | 0.5 |
| Away | 14 | 13 | 24.6 | 1.4 | 4.8 | 6.1 | 3.7 | 0.0 | 0.8 | 2.8 | 0.3 | 1.7 | 0.0 |
| Neutral | 1 | 1 | 17.0 | 4.7 | 2.4 | 7.1 | 2.4 | 0.0 | 0.0 | 2.4 | 0.0 | 2.4 | 0.0 |
- | |||||||||||||
| Wins | 9 | 8 | 24.8 | 1.6 | 5.0 | 6.6 | 3.6 | 0.0 | 1.4 | 2.2 | 0.7 | 1.3 | 0.0 |
| Losses | 21 | 17 | 23.2 | 1.3 | 3.9 | 5.2 | 4.0 | 0.0 | 1.6 | 2.7 | 0.6 | 1.3 | 0.3 |
- | |||||||||||||
| November | 6 | 4 | 25.5 | 1.8 | 3.9 | 5.8 | 5.2 | 0.0 | 3.1 | 2.9 | 1.1 | 1.3 | 0.0 |
| December | 7 | 5 | 24.1 | 1.4 | 7.6 | 9.0 | 3.1 | 0.0 | 1.4 | 2.8 | 0.5 | 1.7 | 0.5 |
| January | 8 | 7 | 26.4 | 1.7 | 2.7 | 4.4 | 3.6 | 0.0 | 0.6 | 1.9 | 0.3 | 0.9 | 0.2 |
| February | 8 | 8 | 20.0 | 0.3 | 3.3 | 3.5 | 4.0 | 0.0 | 1.5 | 2.8 | 0.5 | 1.3 | 0.3 |
| March | 1 | 1 | 17.0 | 4.7 | 2.4 | 7.1 | 2.4 | 0.0 | 0.0 | 2.4 | 0.0 | 2.4 | 0.0 |